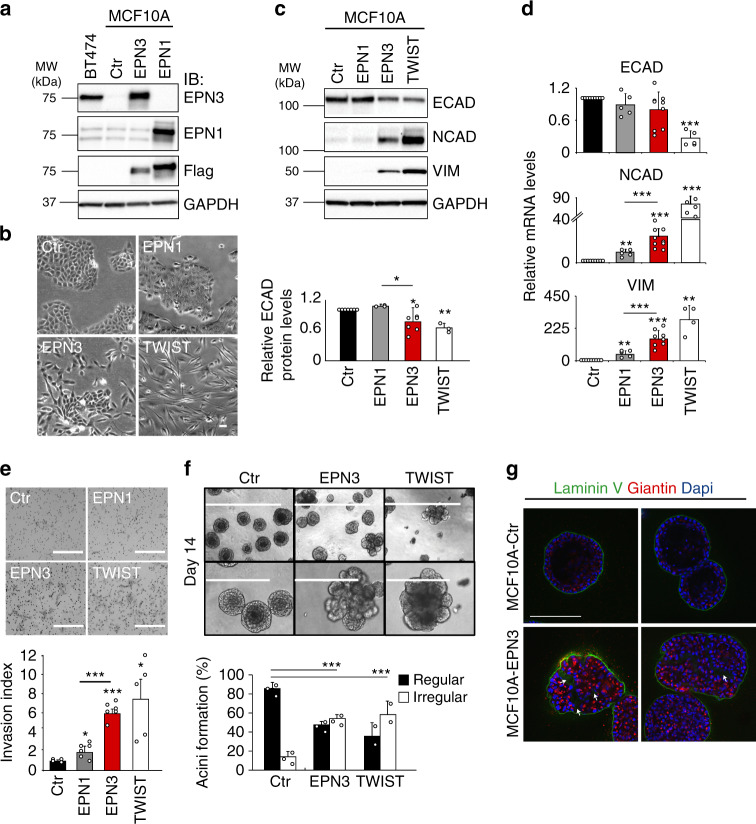
Fig. 2. EPN3 overexpression induces EMT in MCF10A cells.
a MCF10A cells expressing Flag-EPN3 (EPN3) or Flag-EPN1 (EPN1) or empty vector (Ctr), and IB with the indicated Ab. GAPDH, loading control. BT474 cells: positive control for EPN3 overexpression. Left, MW markers. b Phase-contrast microscopy of MCF10A cells as in (a), compared with MCF10A-TWIST. Bar, 50 μm. c, d Expression of EMT markers, in the indicated cell lines, by IB (c) or RT-qPCR (d). In (c, top), GAPDH, loading control. Left, MW markers. In (c, bottom), quantification of ECAD protein levels, normalized on GAPDH expression, is reported as relative fold change compared with Ctr cells. Results are the mean ± S.D. (n ≥ 3). P values (Each Pair Student’s t test, two-tailed) are vs. Ctr, unless differently indicated; *, <0.05; **, <0.01; ***, <0.001; ns, not significant (here and in all other figures). In (d), the data were normalized on the average expression of the housekeeping genes 18S-ACTB-GAPDH, and reported as relative fold change compared with Ctr cells (mean ± S.D., n ≥ 4); unless otherwise indicated, the same normalization procedure was used in all figures. e Matrigel invasion assay of the indicated cells (24 h). Top, representative images (Bar, 400 μm); bottom, invasion index (mean number of invading cells/field over the control) ± S.D. (at least four fields of view were counted/sample, each in two independent experiments). P value, Student’s t test two-tailed. f Morphogenetic Matrigel assay. Top, representative bright-field images at low (bar, 1000 μm) and high magnification (bar, 400 μm) of acini grown in Matrigel. Bottom, ratio between regular vs. irregular/multilobular acini. Results are reported as mean ± S.D. (n = 3 for Ctr and EPN3; n = 2 for TWIST; at least 75 organoids/experiment were counted); acini >50 μm were analyzed for their circularity (regular, circularity >0.8; irregular, circularity <0.8). P value, Fisher’s exact t test two-sided for 2 × 2 contingency table. g Acini as in (f), were subjected to IF with the indicated Ab. Blue, DAPI. Two representative images for each sample are shown. Arrows indicate altered basement membrane deposition. Bar, 200 μm. Source data are provided as a Source Data file.

