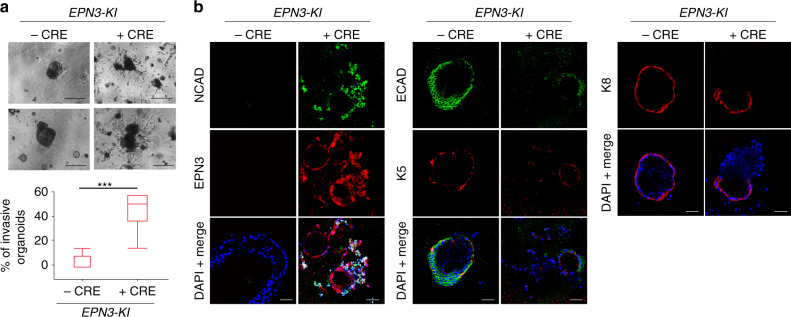
Fig. 3. EPN3 overexpression induces an invasive phenotype in primary organoids.
a Bilayered primary organoids were obtained from the mammary gland of six EPN3-KI mice and treated in vitro (or mock-treated) with Cre. Top, bright-field images. Bar, 270 μm. Bottom, quantification of invasive organoids over total is presented as box plots (N = 90 for -Cre and N = 100 for +Cre). Here and in other figures, each box plot is defined by 25 and 75 percentiles, showing median, whiskers representing 10 and 90 percentiles and outliers if present. P value, Student’s t test, two-tailed. b Bilayered organoids generated as in panel a were subjected to IF with Ab against NCAD, ECAD, EPN3, keratin 5 (K5), keratin 8 (K8). Blue, DAPI. Bar, 45 μm. Source data are provided as a Source Data file.

