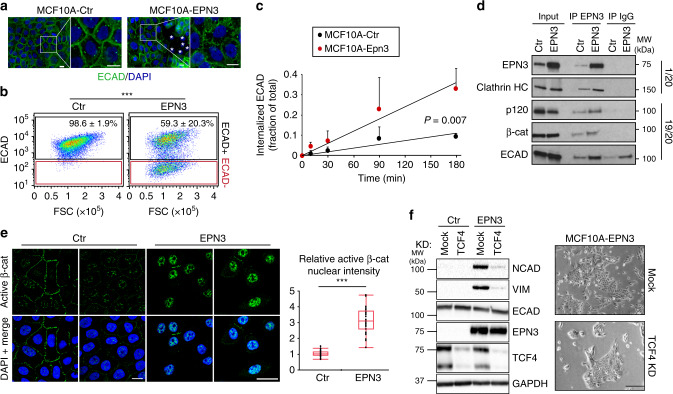
Fig. 4. EPN3 stimulates ECAD internalization and β-catenin/TCF4-dependent EMT.
a IF staining of ECAD (green) in the indicated cells, at confluency. Blue, DAPI. Asterisks, cells lacking ECAD staining. Bar, 10 μm. b Representative FACS analysis of the indicated cells stained in vivo for ECAD. Black and red gates represent ECAD-positive and -negative cells, respectively, and have been set according to the unstained control samples. FSC, forward scatter. Mean percentage of ECAD-positive cells ± S.D. (n = 18) is reported. P value, Student’s t test two-tailed. See also Supplementary Fig. 4B. c Time course of ECAD internalization in the indicated cells measured by FACS analysis. Fraction of mean fluorescence intensity of internalized ECAD signal over the total ± S.D. (n ≥ 3) is reported. Student’s t test, two-tailed. d Lysates (1 mg) from the indicated cells were subjected to immunoprecipitation with anti-EPN3 Ab or with a control IgG. Three independent EPN3 IPs were performed to check p120, β-cat, or ECAD binding. Clathrin binding was analyzed in the same IP experiment of β-cat. In each case, efficiency of EPN3 IP gave comparable result (one representative EPN3 IP/IB is shown). In total, 1/20 and 19/20 of the IPs were loaded separately and subjected to IB analysis with the indicated Ab. Input is 20 µg for the 1/20 panel, and 1 µg for the 19/20 panel. Right, MW markers. Results are representative of at least two independent experiments. e Left, representative confocal images of the indicated cells stained for active β-catenin. Blue, DAPI. Bar, 30 µm. Right, box plot analyses of relative nuclear fluorescence intensity of active β-catenin per cell in MCF10A-Ctr (N = 34) and MCF10A-EPN3 cells (N = 36) in a representative experiment (n = 3). Data were normalized on the median value of nuclear fluorescence intensity in MCF10A-Ctr. P value, each pair, Student’s t test, two-tailed. f TCF4 was silenced in the indicated cells. Negative control, mock transfection. Left, cell lysates were IB with the indicated Ab. GAPDH, loading control. Left, MW markers. See Supplementary Fig. 8C for quantitation and statistics. Right, representative phase-contrast microscopy of mock or TCF4-KD MCF10A-EPN3 cells. Bar, 250 µm. Source data are provided as a Source Data file.

