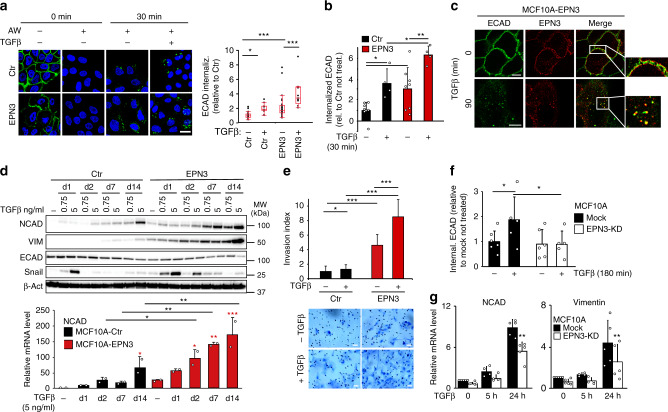
Fig. 5. EPN3 is involved in TGFβ-induced ECAD internalization and TGFβ signaling.
a Left, ECAD internalization assay by IF in the indicated cells using an anti-ECAD Ab against the extracellular domain internalized for 30 min −/+ TGFβ (5 ng ml−1). Cells were subjected or not to an acid wash (AW) to remove the ECAD Ab from the PM, prior fixation. Bar, 20 µm. Right, box plot of relative ECAD fluorescence intensity/field of view (N ≥ 9). P value, each pair Student’s t test two-tailed. b ECAD internalization assay by FACS in the indicated cells, −/+ TGFβ1 (5 ng ml−1, 30 min). Mean fluorescence intensity of internalized ECAD/total ± S.D. (n ≥ 4) is reported. P value, Student’s t test two-tailed. c Representative co-localization images of EPN3 (red) and ECAD (green), during ECAD internalization as in (a). Bars, 10 µm. d Top, lysates from the indicated cells −/+ TGFβ1 (0.75 or 5 ng ml−1, for the indicated days—d) were IB with the indicated Ab. β-actin, loading control. Right, MW markers. Bottom, NCAD mRNA levels by RT-qPCR on samples −/+ TGFβ1 (5 ng ml−1). Mean relative mRNA expression vs. MCF10A-Ctr (not stimulated) ± S.D. (two independent experiments, each in technical triplicates) is reported. P value, each pair Student’s t test, two-tailed. Black asterisks, statistical significance between each corresponding time point of EPN3 vs. Ctr; red asterisks, statistical significance between stimulated vs. not stimulated samples of MCF10A-EPN3 or -Ctr cells. e Matrigel invasion assay of the indicated cells −/+ TGFβ (0.75 ng ml−1). Top, invasion index (mean number of invading cells/field vs. control) ± S.D. (N ≥ 22). P value, Student’s t test two-tailed. Bottom, representative images. Bar, 50 µm. f ECAD internalization assay by FACS analysis in MCF10A-Ctr −/+ EPN3 silencing, −/+ TGFβ1 (5 ng ml−1, 180 min). Mean fluorescence intensity of internalized ECAD/total ± S.D. (n ≥ 5) is reported. P value, Student’s t test two-tailed. g RT-qPCR analysis of NCAD and VIM mRNA levels in cells as in (f). Mean relative mRNA expression vs. mock-unstimulated cells ± S.D. (n ≥ 4) is reported. P value, each pair Student’s t test, two-tailed. Source data are provided as a Source Data file.

