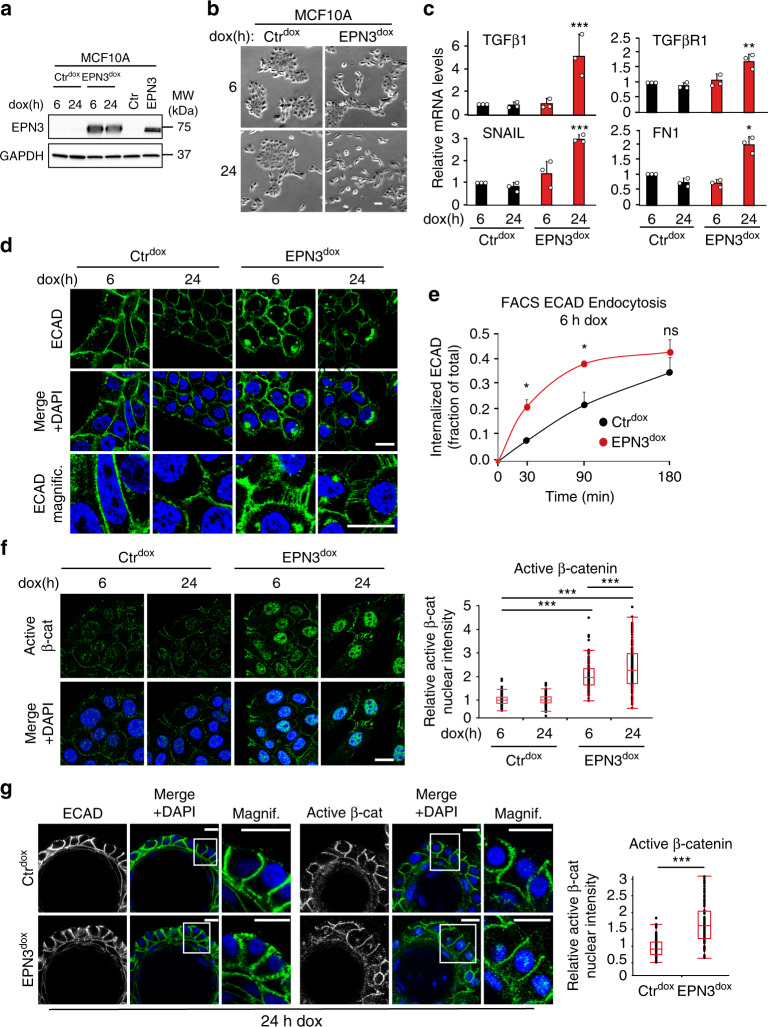
Fig. 7. ECAD accelerated endocytosis is the initial event in EPN3-driven EMT.
a MCF10A-Ctr cells were infected with pSLIK-empty vector (Ctrdox) or pSLIK-EPN3 (EPN3dox) and treated for 6 h or 24 h with 200 μg ml−1 doxycycline (dox). Lysates were subjected to IB analysis with the indicated Ab. GAPDH, loading controls. Lysates of MCF10A-Ctr and MCF10A-EPN3 were loaded in parallel as controls. Right, MW markers. b Phase-contrast microscopy of cells as in (a). Bar, 60 μm. c RT-qPCR analysis of mRNA expression of the indicated genes in cells as in (a). Mean relative mRNA expression compared with MCF10A-Ctr, ± S.D. is reported (n = 3, each performed in technical triplicates). P value, each pair Student’s t test, two-tailed. d IF staining of ECAD (green) in cells (a). Blue, DAPI. Bar, 20 μm. e Time course of ECAD internalization measured by FACS analysis in MCF10A-Ctrdox and -EPN3dox cells treated with dox for 6 h. Data are reported as fraction of mean fluorescence intensity of internalized ECAD signal over the total, ± S.D. (n = 3). P values, Student’s t test two-tailed. f Left, representative confocal images of the indicated cells dox-induced for 6 h and 24 h, and stained for active β-catenin. Blue, DAPI. Bar, 20 µm. Right, box plot analyses of relative nuclear fluorescence intensity of active β-catenin per cell in MCF10A-Ctrdox 6 h (N = 222), MCF10A-Ctrdox 24 h (N = 323), MCF10A-EPN3dox 6 h (N = 98) and MCF10A- EPN3dox 24 h cells (N = 144) in a representative experiment (n = 3). Data were normalized on the median value of nuclear fluorescence intensity in the MCF10A-Ctrdox 6 h sample. P value, each pair Student’s t test, two-tailed. g Left, acini grown in 3D on top of Matrigel for 13 days were treated for 24 h with doxycycline and then subjected to IF with the indicated Ab. Blue, DAPI. Bar, 20 μm. Right, box plot of relative nuclear fluorescence intensity of active β-catenin per cell in a representative experiments of two independent replicates. Data were normalized on the median value of nuclear fluorescence intensity in the MCF10A-Ctrdox 24 h sample. MCF10A- Ctrdox (N = 86) and MCF10A-EPN3dox cells (N = 91). P value, each pair Student’s t test two-tailed. Source data are provided as a Source Data file.

