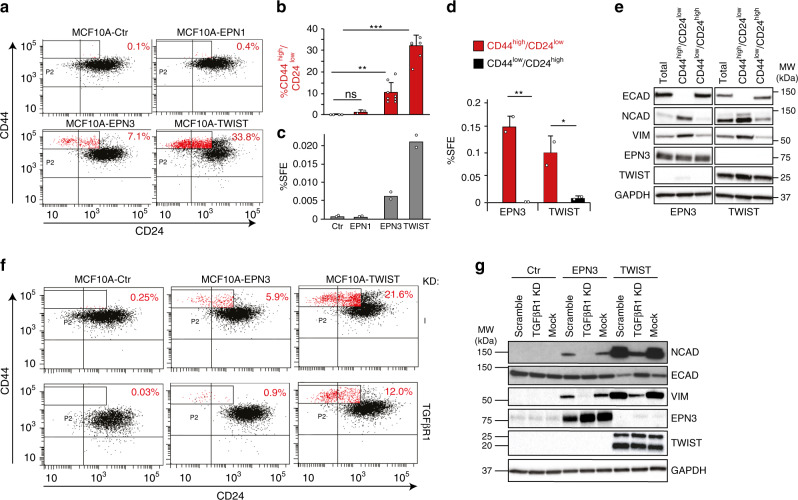
Fig. 8. EPN3 overexpression expands a cellular compartment with features of CSCs.
a Representative bi-parametric (CD44/CD24) FACS analysis of MCF10A cells expressing the indicated constructs. The CD44high/CD24low population is boxed and shown in red, with the relative percentage. See also Supplementary Fig. 10A for a different representation of the results. b The size of the CD44high/CD24low population (measured by FACS as in a) in the indicated samples is reported as a percent of the total. Mean ± S.D. of at least two independent experiments is shown (N, Ctr=4, EPN1 = 2, EPN3 = 8, TWIST = 6). P value, each pair Student’s t test two-tailed. c Mammosphere assay on MCF10A cells expressing the indicated constructs. Results are expressed as mean sphere-forming efficiency (SFE) of two independent experiments. P value, each pair Student’s t test two-tailed. d Mammosphere assay on the CD44high/CD24low and CD44low/CD24high FACS-sorted subpopulations of MCF10A cells expressing the indicated constructs. Results are expressed as mean SFE ± S.D. of two independent experiments, each performed in technical triplicates. P value, each pair Student’s t test two-tailed. e The indicated FACS-sorted populations from MCF10A-EPN3 or -TWIST cells were analyzed by IB as shown and compared to the total unsorted population. GAPDH, loading control. This panel was assembled from samples run on the same gel by splicing out the irrelevant lanes, as shown by the black lines. MW markers are shown on the right. f Representative bi-parametric (CD44/CD24) FACS analysis of the indicated cell lines, mock-silenced (Ctr, top) or silenced for TGFβR1 (bottom). The CD44high/CD24low population is boxed and shown in red, with the relative percentage. Results are representative of two independent experiments. g MCF10A cells expressing the indicated constructs were transfected with a non-targeting oligo (scramble), mock-transfected (mock), or silenced for TGFβR1 (TGFβR1 KD) and analyzed by IB. GAPDH, loading control. MW markers are shown on the left. Source data are provided as a Source Data file.

