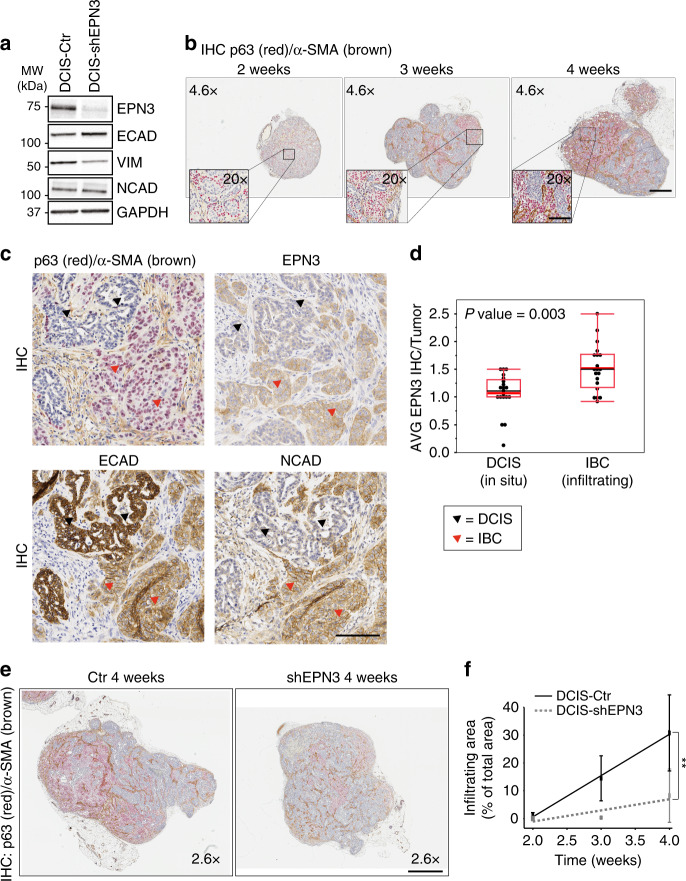
Fig. 9. EPN3 expression during the progression from in situ to invasive BC.
a Expression of EMT markers in MCF10DCIS.com cells infected with control vector (DCIS-Ctr) or shEPN3 (DCIS-shEPN3) by IB with the indicated Ab. GAPDH, loading control. Left, MW markers. b IHC double staining of p63 (red)/α-SMA (brown) in tumors grown from MCF10DCIS.com cells engrafted in the mammary fat pad over time (2–3–4 weeks). Bar, 500 µm. Inset, magnifications (×20) of the indicated areas. Bar, 100 µm. c, d Five consecutive sections of 20 DCIS-Ctr tumors derived as described in (a) and (b) were stained with H&E (not shown), p63/α-SMA, EPN3, NCAD, or ECAD Abs. c IHC images of in situ (DCIS, black arrowheads) and infiltrating (IBC, red arrowheads) areas of a representative DCIS-Ctr tumor stained with the indicated Ab on consecutive sections. p63 (red) and α-SMA (brown) were double stained. Images at ×20. Bar, 100 µm. d All the areas with clearly distinct components of DCIS present in each tumor, and adjacent IBC areas, were identified based on H&E and p63/α-SMA staining. In these matched DCIS vs. IBC areas, EPN3 expression was evaluated by IHC using intensity scores ranging from 0 to 3 as described for TMA analysis (see “Methods”), and an average score was then calculated for all the DCIS and IBC areas identified within each tumor. Box plot of the average EPN3 expression measured in DCIS and paired IBC areas of each MCF10DCIS.com-Ctr tumor at 2, 3, 4, 5 weeks (N, number of tumors analyzed = 20). P value, Wilcoxon test. e Representative images of the double IHC staining of p63 (red)/α-SMA (brown), in DCIS-Ctr and DCIS-shEPN3 tumors at 4 weeks. One image for each tumor is shown (×2.6). Bar, 800 µm. The red/brown color marks the invasive areas. f Percentage of infiltrating areas normalized on the total tumor area was measured for each DCIS-Ctr and DCIS-shEPN3 tumor at each time point. Results at each time point represent the mean ± S.D. of at least four tumors per time point per condition (DCIS-Ctr and -shEPN3). P value, Student’s t test two-tailed. Source data are provided as a Source Data file.

