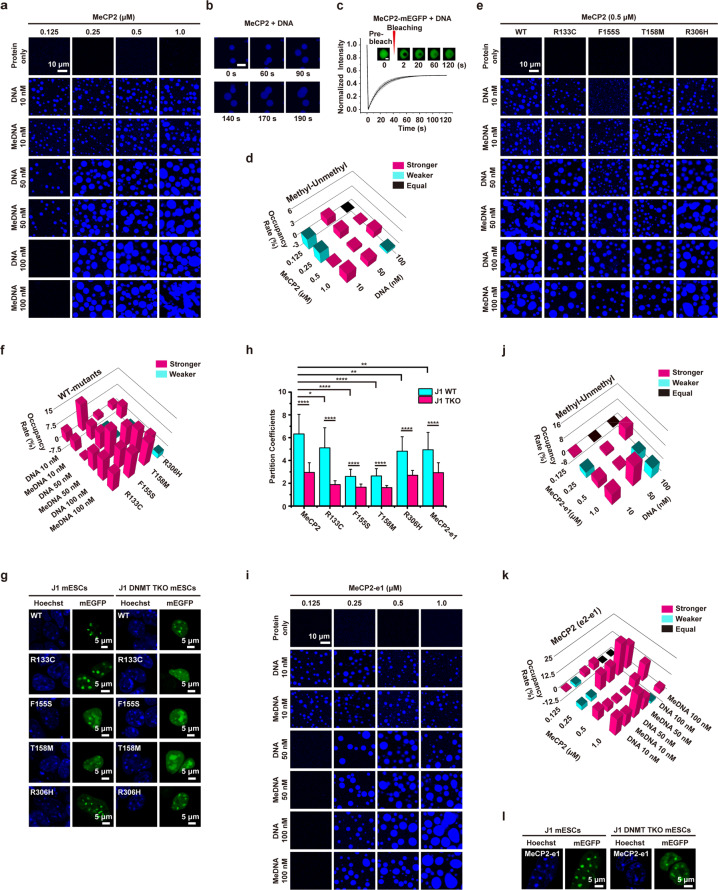
Fig. 1. Rett mutants attenuate phase separation of MeCP2.
a Phase diagram of MeCP2 with unmethylated DNA or methylated DNA (MeDNA) in 150 mM NaCl. DAPI was used for DNA visualization. Scale bar, 10 µm. b Fusion of droplets formed by MeCP2 protein (1.0 μM) with DNA (100 nM) in 150 mM NaCl. Scale bar, 5 µm. c FRAP analysis of droplets formed by MeCP2-mEGFP protein (1.0 μM) with DNA (100 nM) after incubating 5 min on 384-well microplates. Scale bar, 2 µm. All data are presented as mean ± SD (n = 3). d Comparison of phase diagrams of MeCP2 with methylated DNA (MeDNA) and unmethylated DNA in Fig. 1a. Pink, cyan, and black squares indicate stronger, weaker and unchanged LLPS. e Phase diagram of MeCP2 wild-type and Rett mutant proteins (0.5 µM) with DNA or MeDNA in 150 mM NaCl. DAPI was used for DNA visualization. Scale bar, 10 µm. f Comparison of phase diagrams of MeCP2 wild-type and mutant proteins (0.5 µM) with DNA or MeDNA in (e). g Subcellular localization of MeCP2 and Rett mutants tagged with mEGFP overexpressed in J1 wild-type and DNMT TKO mESCs. Hoechst was used to stain DNA. Scale bar, 5 µm. h Partitioning quantification of MeCP2-mEGFP proteins. ****p < 0.0001, ***p < 0.001, **p < 0.01, *p < 0.1. i Phase diagram of MeCP2-e1 with DNA or MeDNA in 150 mM NaCl. DAPI was used for DNA visualization. Scale bar, 10 µm. j Comparison of phase diagrams of MeCP2-e1 with MeDNA and DNA in (i). k Comparison of phase diagrams of MeCP2-e2 and MeCP2-e1 with DNA or MeDNA in (a, i). l Subcellular localization of MeCP2-e1-mEGFP overexpressed in J1 wild-type and DNMT TKO mESCs. Scale bar, 5 µm.

