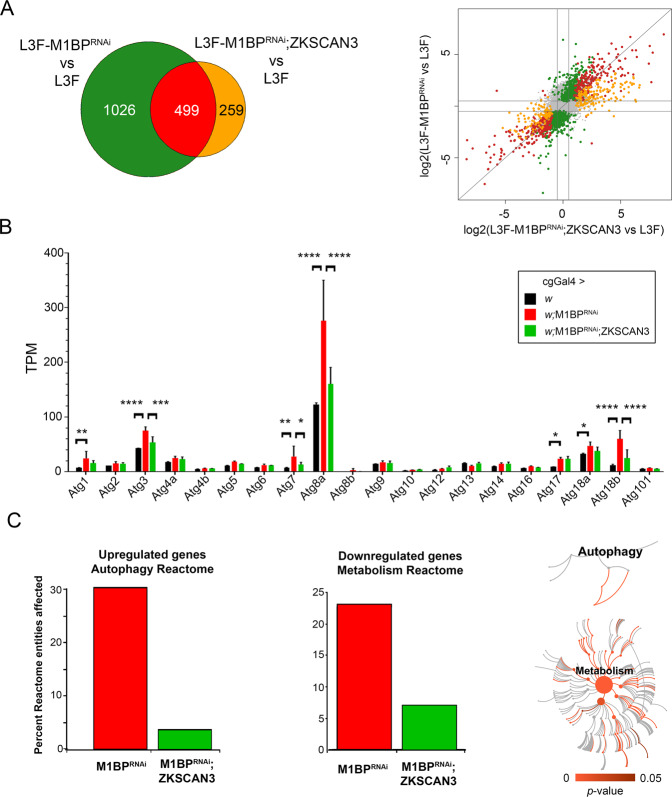
Figure 3.
M1BP RNAi leads to widespread gene deregulation that is largely prevented through ZKSCAN3 co-expression. (A) Weighted Venn diagram representation of RNA-seq-identified L3F differentially expressed genes (DEGs) upon M1BP RNAi knockdown and DEGs in M1BP RNAi;ZKSCAN3 co-expressing fat body cells highlighting that more than two-thirds (1026) of M1BP RNAi-induced DEGs are prevented by ZKSCAN3 co-expression. Scatter plot of log2 fold changes in gene expression upon M1BP RNAi (ordinate) and M1BP RNAi;ZKSCAN3 (abscissa) co-expressing L3F fat body cells. Differential gene expression analyses identifying DEGs in both conditions are marked in red, genes prevented from being differentially expressed upon M1BP RNAi through ZKSCAN3 co-expression are shown in green and DEGs present in only M1BP RNAi;ZKSCAN3 fat bodies are shown in orange. Genes not differentially expressed in any condition are in grey. (B) Average transcripts per million (TPM) from biological replicate RNA-seq counts for all autophagy-related genes (Atg) show significant upregulation of numerous Atg genes upon M1BP RNAi that is prevented by ZKSCAN3 co-expression. Error bars represent standard deviation of mean replicate values. (C) Reactome pathway enrichment analysis36 identified the “Autophagy Reactome” pathway as significantly enriched with 30% of pathway entities being upregulated upon M1BP RNAi and the “Metabolism Reactome” as significantly enriched with 23% of pathway entities being downregulated upon M1BP RNAi. In both cases, the majority of deregulated pathway genes are restored to wild type values upon ZKSCAN3 co-expression leading to the absence of pathway enrichment. The pathway illustrations (CC BY 4.0 license) as provided by the Reactome analyses36 significantly affected within each of the reactomes are shown in red while not significant pathways are shown in grey.

