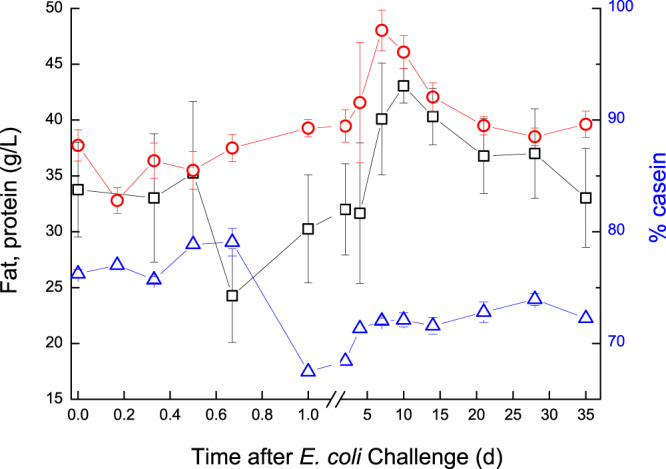
Figure 3.

Fat, protein and % casein in milk of glands infected with pathogenic Escherichia coli. Mean and SE of fat ( ; g/L), protein (
 ; g/L) and % casein (
 ), measured in the infected glands of 10 cows challenged with different mammary pathogenic strains of E. coli. Fat decreased during the first 2 h and then increased (P < 0.001) up to 7–10 DPC and gradually returned to pre-challenged level only at 35 DPC. Total protein decreased (P < 0.001) at 6–8 h PC, after which it increased up to a peak at 7–10 DPC, returning to pre-challenged levels at 35 DPC. % casein decreased from ~78% to ~68% between 8–24 h PC, then gradually increased afterwards but remained lower (P < 0.05) than pre-challenged levels until the end of the study.
