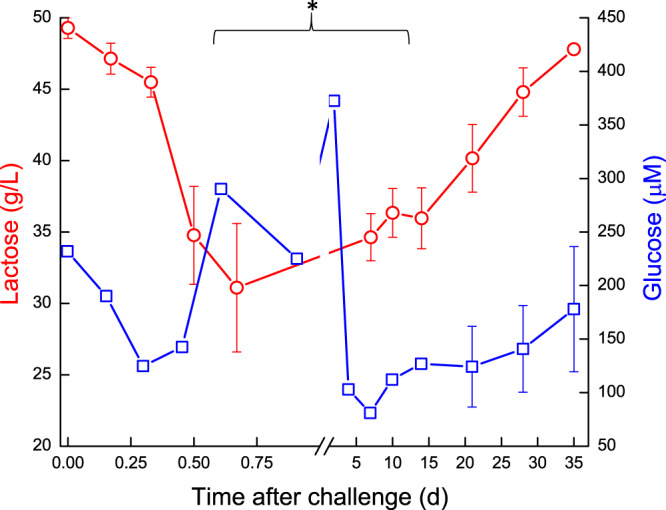
Figure 5.

Lactose and glucose levels in milk of glands infected with pathogenic Escherichia coli. Mean and SE of lactose ( ; g/L) and glucose (
 ; μM) measured in the infected glands of 10 cows challenged with different mammary pathogenic strains of E. coli. Glucose concentration increased significantly (P < 0.05) on day 2 followed by a sharp decrease on day 4 and gradually increase thereafter. *significantly different from time 0 for lactose between 0.5–10 days (P < 0.05).
