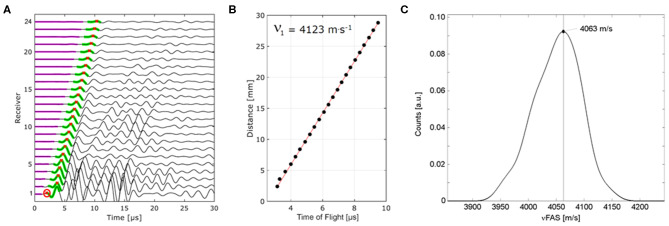
Figure 3.
Ultrasound signals recorded at the receiver array after the excitation of a signal from one emitter (A). For each receiver element, the first arriving signal exceeding the noise floor (magenta) is time-gated (green) and the time-of-flight of the first peak (red crosses) is detected. Pulse travel times linearly increasing with emitter-receiver distance are used to calculate the propagation velocity in this direction (B). Other signals [the encircled signal of receiver channel 1 in (A)], were automatically excluded. From the distribution of all measured velocities, the peak position was used for further evaluation.

