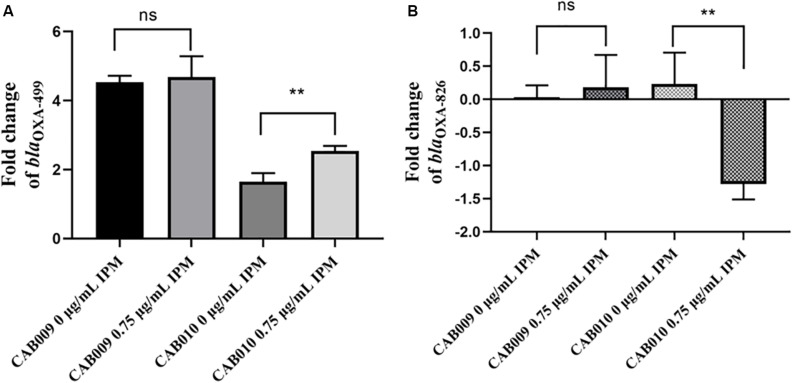
FIGURE 3.
Log2 fold changes of (A) blaOXA–499 and (B) blaOXA–826 expression levels in mutants undergoing or not imipenem selection pressure. RT-qPCR analysis was performed with three biological and technical replicates per experiment. The 2–ΔΔCt method was applied to calculate the fold change using rpoB as the reference gene and Acinetobacter pittii A1254 as the reference strain. The expression level was calculated as the log2 fold change. The bars represent means ± SD from triplicate biological repeats. The P-values (each mutant undergoing or not imipenem selection pressure) were determined by two-tailed Student’s t-tests. **P < 0.008; ns, not significant. IPM, imipenem.

