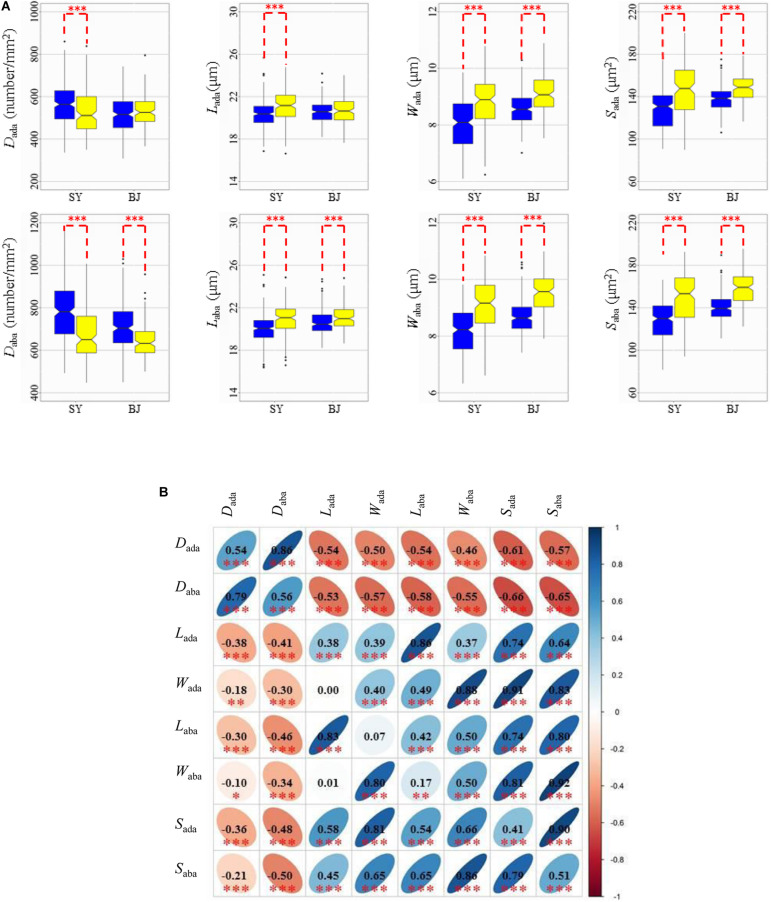
FIGURE 1.
Values and correlations of stomata-related traits in two environments. (A) Box plots of eight stomata-related traits in Sanya (SY) and Beijing (BJ) between xian and geng rice (Oryza sativa L.) panels. Blue and yellow colors indicate xian and geng, respectively. ***Denotes significance of Student’s t-test at P < 0.001. Dada, stomatal density on the adaxial surface; Daba, stomatal density on the abaxial surface; Lada, guard cell length on the adaxial surface; Laba, guard cell length on the abaxial surface; Wada, guard cell width on the adaxial surface; Waba, guard cell width on the abaxial surface; Sada, stomatal size on the adaxial surface; Saba, stomatal size on the abaxial surface. (B) Correlations between the eight tested traits in SY (upper diagonal) and BJ (lower diagonal). The values are correlation coefficients (r) multiplied by 100. The values on the main diagonal are correlations between SY and BJ. The areas and colors of ellipses correspond to absolute values of the corresponding r. Right and left oblique ellipses indicate positive and negative correlations, respectively. Values without glyphs were insignificant at the 0.05 probability level. *, **, *** Indicate significant correlations at P < 0.05, P < 0.01, and P < 0.001, respectively.

