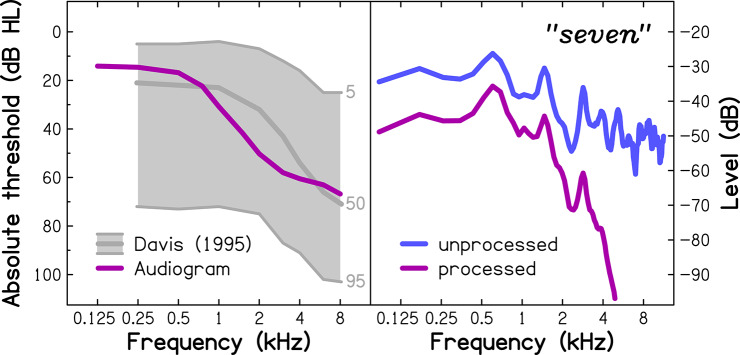
Figure 1.
(Left panel) Extrapolated audiometric thresholds for an average 75-year-old listener (audiogram), used for the simulation of age-related hearing loss. For comparison, mean audiometric thresholds for 70- to 79-year-olds from a population-representative sample (Davis, 1995) are shown in the form of audiograms corresponding to the 5th, 50th, and 95th percentiles (light-gray lines). (Right panel) Average power spectra of the unprocessed (blue line; used with the NH group) and processed (purple line; used with the SHL group) spoken word “seven”.

