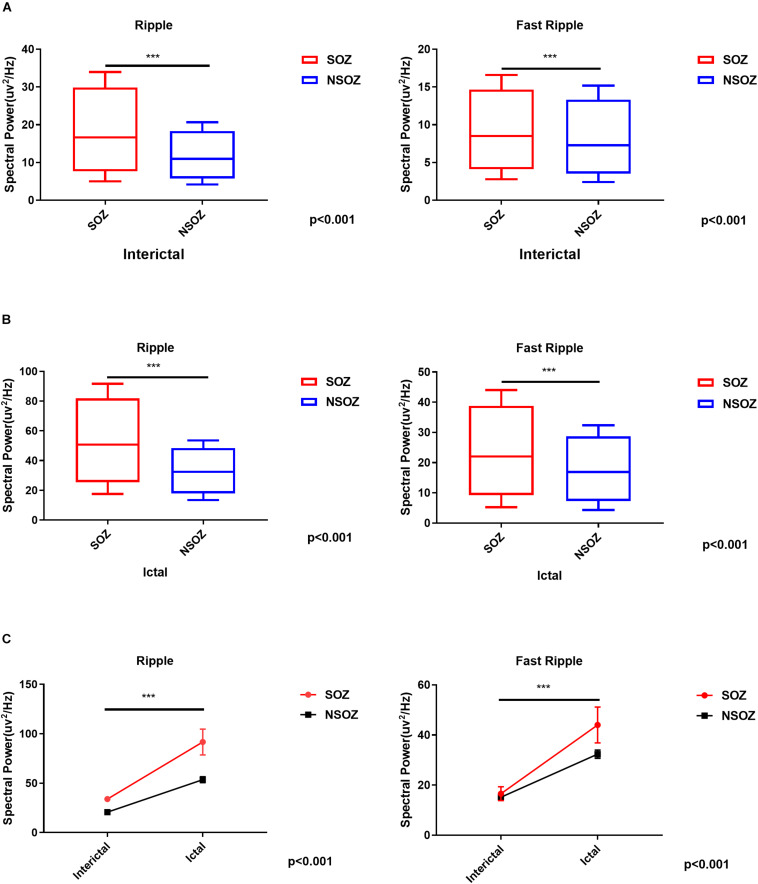
FIGURE 4.
Comparisons of the mean ripple and fast ripple spectral power between the seizure onset zone and non-seizure onset zone during (A) interictal and (B) ictal periods. (C) Mixed-design analyses of variance show dynamic increases of mean ripple and fast ripple spectral power from interictal to ictal periods between the seizure onset zone and non-seizure onset zone. ***p < 0.001.

