Figure 2.

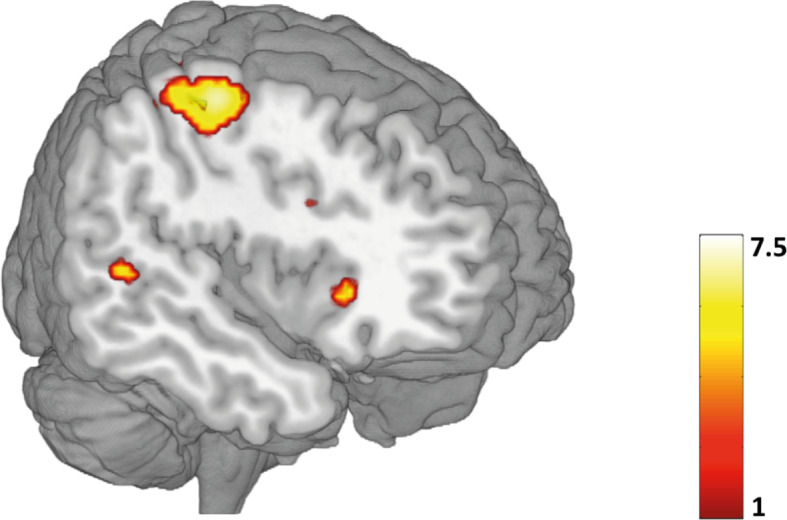
Whole-brain task activation during correct inhibition (NoGo > Go) for the whole sample (p <.05, FWE corrected). Color bar represents t-values. A list of all significant activations for this contrast can be found in Table 3.

Whole-brain task activation during correct inhibition (NoGo > Go) for the whole sample (p <.05, FWE corrected). Color bar represents t-values. A list of all significant activations for this contrast can be found in Table 3.