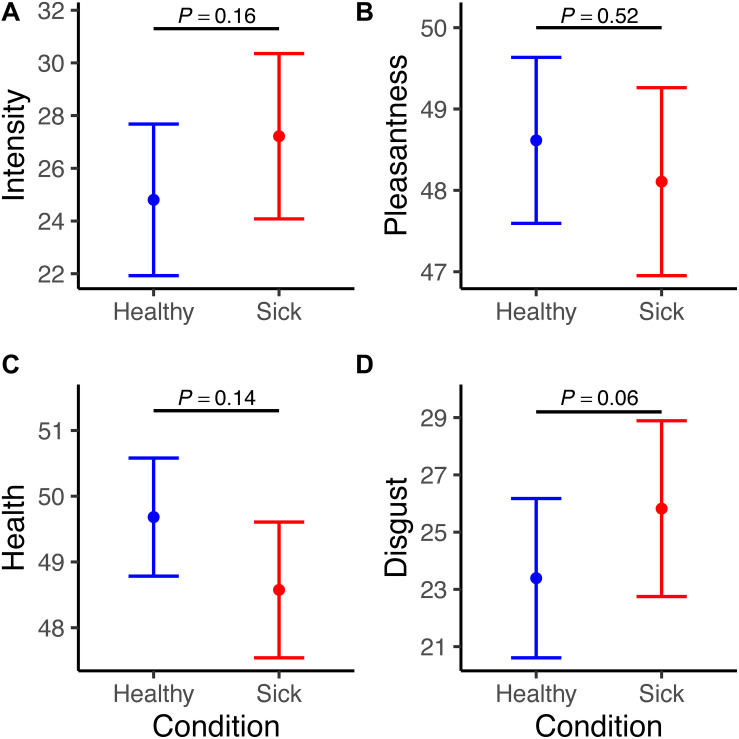
FIGURE 2.
Graphs depict ratings on (A) intensity, (B) pleasantness, (C) health, and (D) disgust for both sick (red) and healthy (blue) body odors (predicted values from the Linear Mixed Models). The scales were ranging from 0 (not intense/pleasant/healthy/disgusted) to 100 (very intense/pleasant/healthy/disgusted). Error bars indicate standard error.

