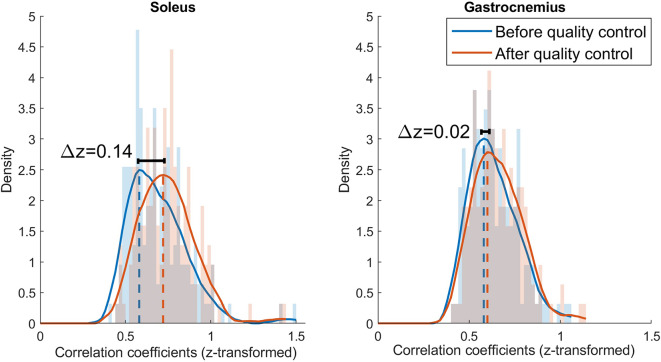
Figure 4.
Histograms and kernel density functions for the z-transformed correlation distribution of the soleus and gastrocnemius before and after quality control. The histograms are normalized by the power spectral density and the density function is estimated with a Epanechnikov kernel. The data before quality control is represented in blue and after quality control in orange.

