
Figure 5.
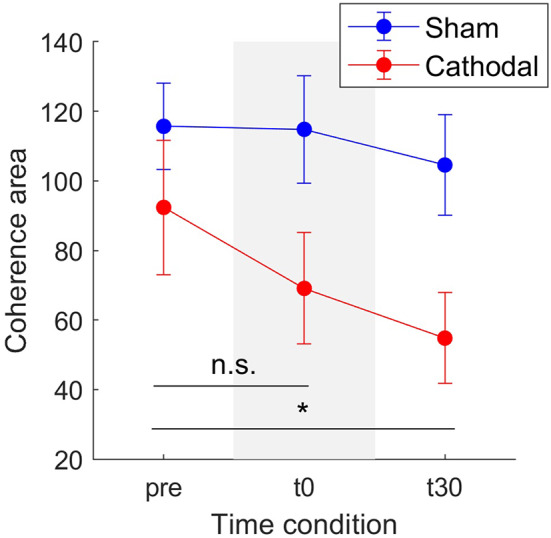
Mean coherence area in the delta band for sham (blue) and cathodal (red) stimulation at pre, just after (t0) and 30 min after (t30) stimulation. (*) indicates significant differences between t30 and pre-stimulation (p < 0.05) and n.s. stands for no significance between pre and t0. Error bars represent standard error measure.