
Figure 6.
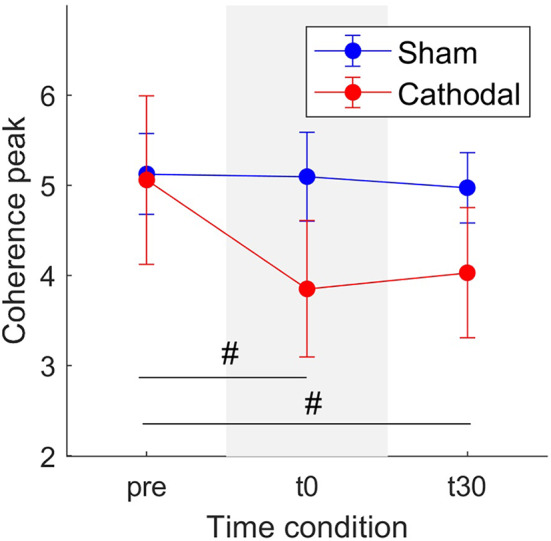
Mean coherence peak in the delta band for sham (blue) and cathodal (red) stimulation at pre, just after (t0) and 30 min after (t30) stimulation. (#) indicates slight evidence of significant differences between pre and t0 and between pre and t30. Error bars represent standard error measure.