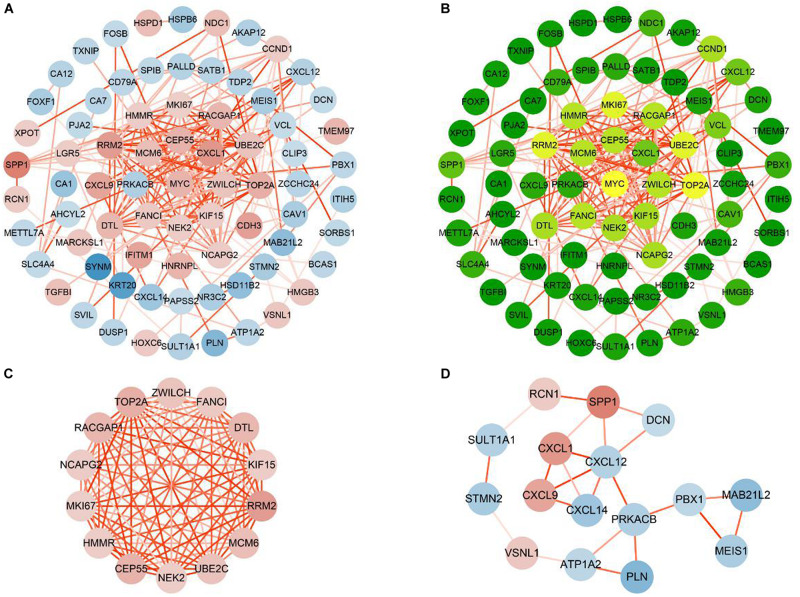
FIGURE 5.
Construction and analysis PPI networks of consensus genes. (A) PPI network of 75 consensus genes. Red nodes represent up-regulated genes, and blue nodes represent down-regulated genes. The color of the node deepens as the value of |log2FC| increases. The color of the line connecting the circles deepens as the confidence scores increase. (B) Degree values of 75 consensus genes were obtained by CentiScaPe. As the degree values increase, the color of the node changes from green to yellow. (C) Module 1 (MCODE score = 13.8466). (D) Module 2 (MCODE score = 3.067).

