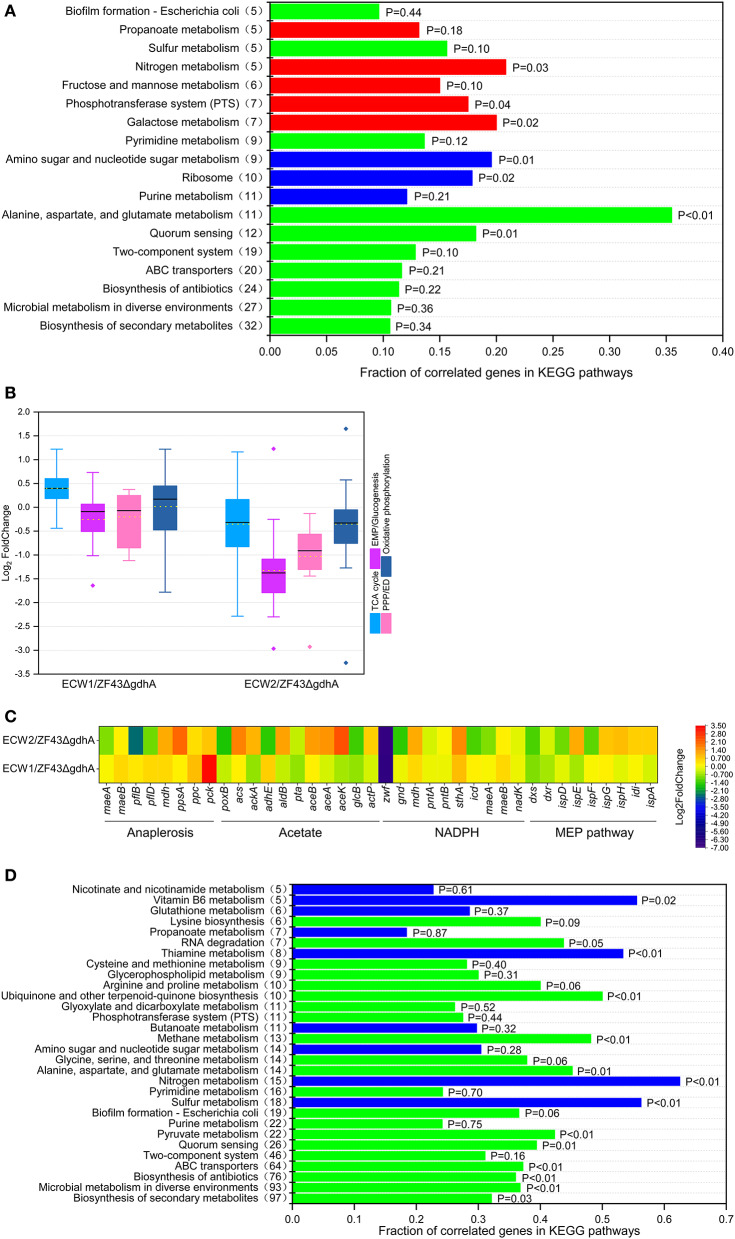
Figure 3.
Comparative transcriptomic analysis of Escherichia coli strains ZF43ΔgdhA, ECW1, and ECW2. (A) Fraction of correlated genes in KEGG pathways of strain ECW1 relative to those of strain ZF43ΔgdhA. The x-axis indicates the ratio of the number of genes differentially expressed in the pathway relative to the total number of genes in the pathway. The y-axis numbers in parentheses are the number of genes differentially expressed in the pathway. Red indicates an upregulated pathway, blue a downregulated pathway, and green a pathway containing both upregulated and downregulated genes. (B) Box plot of the log2FoldChange of the differentially expressed genes participating in the TCA cycle, EMP/gluconeogenesis pathway, pentose phosphate pathway, and oxidative phosphorylation in strains ECW1 and ECW2 relative to those in strain ZF43ΔgdhA. The bold line in the box indicates the median and the yellow dot indicates the mean. The lower and upper bounds of the box indicate the first and third quartiles, respectively, and the whiskers show ±1.5× the interquartile range. (C) Transcriptional levels of genes related to the anaplerotic pathways, acetate pathways, NADPH pathways, and methylerythritol phosphate (MEP) pathways in strains ECW1 and ECW2 relative to those in strain ZF43ΔgdhA. (D) Fraction of correlated genes in KEGG pathways of strain ECW2 relative to those of strain ECW1. The meaning of the colors is the same as in (A).

