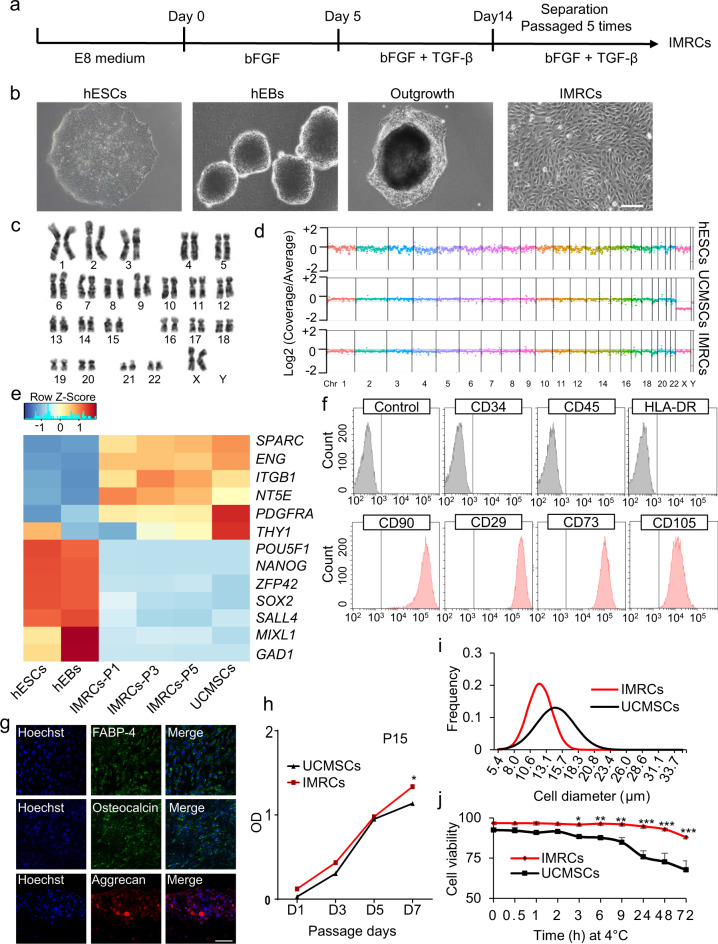
Fig. 1. Derivation of IMRCs from hESCs.
a Different phase of the IMRCs derivation protocol. b Representative morphology of cells at different stages as observed by phase contrast microscopy. hEBs human embryoid bodies. Scale bar, 100 µm. c A representative chromosome spread of normal diploid IMRCs with 22 pairs of autosomes and two X chromosomes. d Copy number variation (CNV) analysis by whole-genome sequencing for hESCs, primary UCMSCs and IMRCs. UCMSCs, umbilical cord mesenchymal stem cells. e Heatmap showing MSC-specific marker and pluripotency marker gene expression changes, from hESCs and hEBs to IMRCs at passages 1–5 (P1–5), and primary UCMSCs. f IMRCs’ expression of MSC-specific surface markers was determined by flow cytometry. Isotype control antibodies were used as controls for gating. Like MSCs, the IMRCs are CD34−/CD45−/HLA–DR−/CD90+/CD29+/CD73+/CD105+ cells. g Representative immunofluorescence staining of IMRCs after they were induced to undergo adipogenic differentiation (FABP-4), osteogenic differentiation (Osteocalcin), and chondrogenic differentiation (Aggrecan). Scale bar, 100 µm. h Proliferation curve of IMRCs and UCMSCs at the 15th passage (n = 5). i Distribution of cell diameters of IMRCs and UCMSCs. j Viability of IMRCs and UCMSCs in clinical injection buffer over time at 4 °C. *P < 0.05, **P < 0.01, ***P < 0.001; data are represented as the mean ± SEM.

