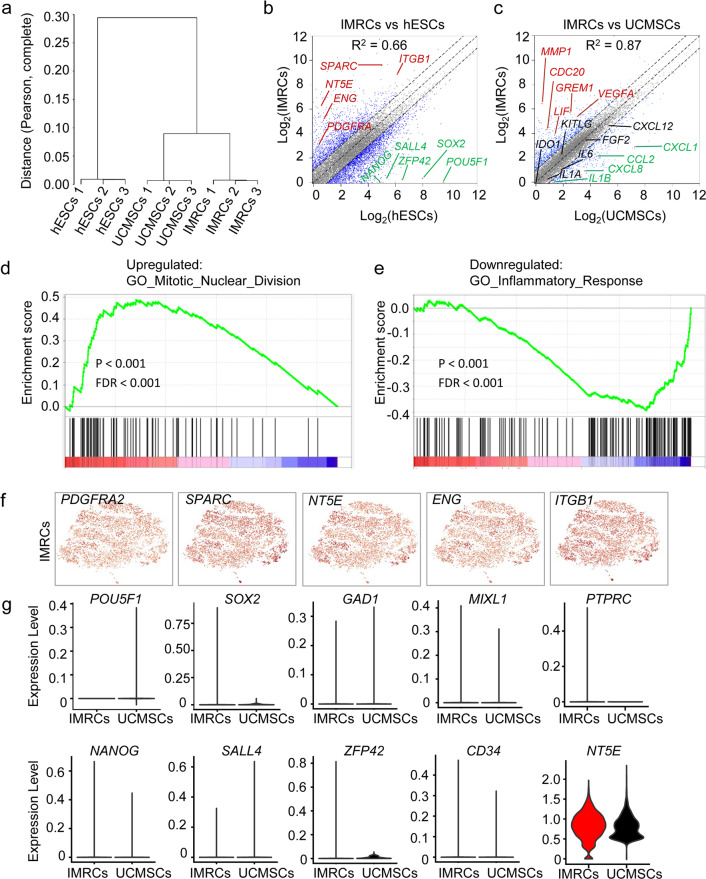
Fig. 2. IMRCs possess unique gene expression characteristics.
a Unsupervised hierarchical clustering analysis based on the Pearson correlation distance between the whole mRNA profile of each cell type. b Scatter plot displaying the differentially expressed genes (DEGs) between IMRCs and hESCs. Up-regulated genes are highlighted in red. Down-regulated genes are highlighted in green. Gray dots represent non-DEGs (less than twofold change). c Scatter plot displaying the DEGs between IMRCs and primary UCMSCs. Up-regulated genes are highlighted in red. Down-regulated genes are highlighted in green. Gray dots represent non-DEGs (less than twofold change). d Gene set enrichment analysis (GSEA) of the top up-regulated gene signature in IMRCs, compared with primary UCMSCs. e GSEA of the top down-regulated gene signature in IMRCs, compared with UCMSCs. f Heatmaps of specific gene expression amongst single IMRCs groups. g Quantification of non-mesenchymal marker gene expression amongst single IMRCs, UCMSCs and hESCs, as measured by scRNA-seq.

