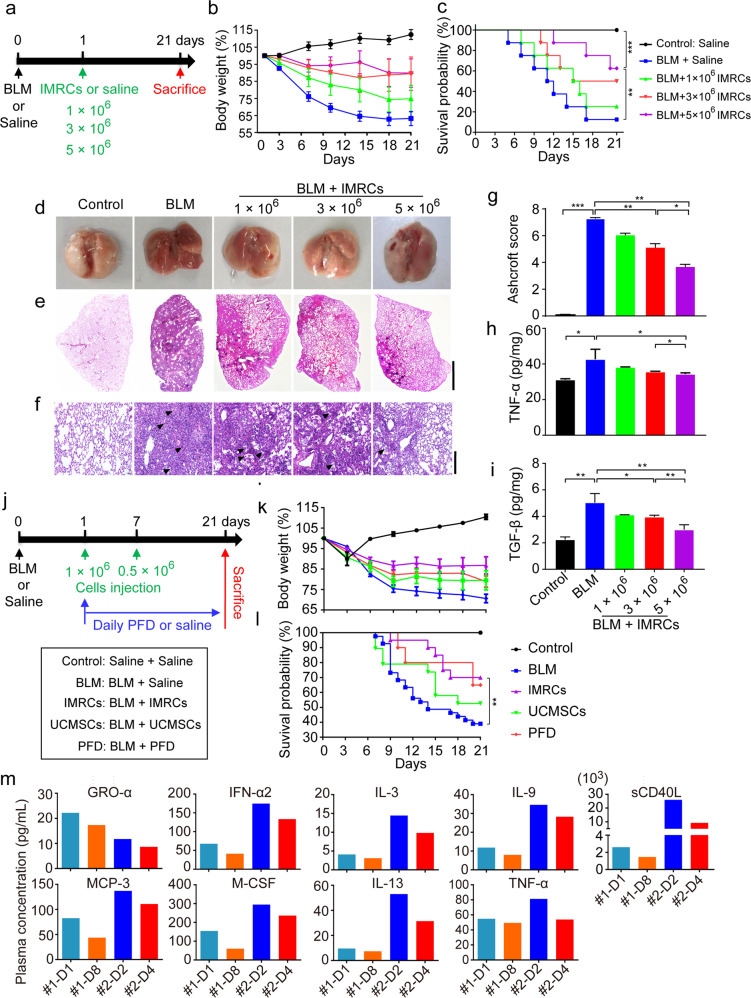
Fig. 6. IMRC transfusion treats lung injury and fibrosis dose dependently.
a Diagram of the animal experimental protocol for dose escalation. Mice received intratracheal bleomycin (BLM; 2.5 mg/kg body weight) or the same amount of saline at day 0. At day 1, some BLM-injured mice received an intravenous (I.V.) injection of 1 × 10⁶, 3 × 10⁶ or 5 × 10⁶ IMRCs via the caudal vein. A group of BLM-injured mice and normal control mice received the same volume of saline. Mice were randomly grouped (n = 8 per group). b Relative body weight (%) changes of the mice receiving different interventions. c Kaplan-Meier survival curves of the mice receiving different interventions. d Representative images of whole lung from all groups at day 21 post-injury. Representative histology of lung sections stained with H&E at day 21 post-injury. Scale bars, 2 mm (e) and 200 µm (f). Arrowheads, inflammatory infiltration. g Quantitative evaluation of fibrotic changes with the Ashcroft score in lungs of mice receiving different interventions. The Ashcroft scores based on the lung H&E sections. The severity of fibrotic changes in each section was assessed as the mean score of severity in the observed microscopic fields. Six fields per section were analyzed. h, i ELISA for the protein levels of TNF-α and TGF-β1 in the lungs of mice receiving different interventions. j Diagram of the animal experimental protocol for multiple arm testing. Double I.V. injections of 1 × 10⁶ and 0.5 × 10⁶ IMRCs (at day 1 and 7 respectively) were compared side-by-side with double I.V. injections of 1 × 10⁶ and 0.5 × 10⁶ UCMSCs (at days 1 and 7 respectively), vs daily pirfenidone (PFD) or saline treatments of mice injured with intratracheal bleomycin (BLM; 2.5 mg/kg body weight) at day 0. k Relative body weight (%) changes of mice receiving different interventions. l Kaplan-Meier survival curves of mice receiving different interventions. m ELISA analysis of pro-inflammatory cytokines in the plasma of two ALI patients after intravenous IMRC transfusion. *P < 0.05, **P < 0.01, ***P < 0.001; data are represented as the mean ± SEM.

