
Figure 2.
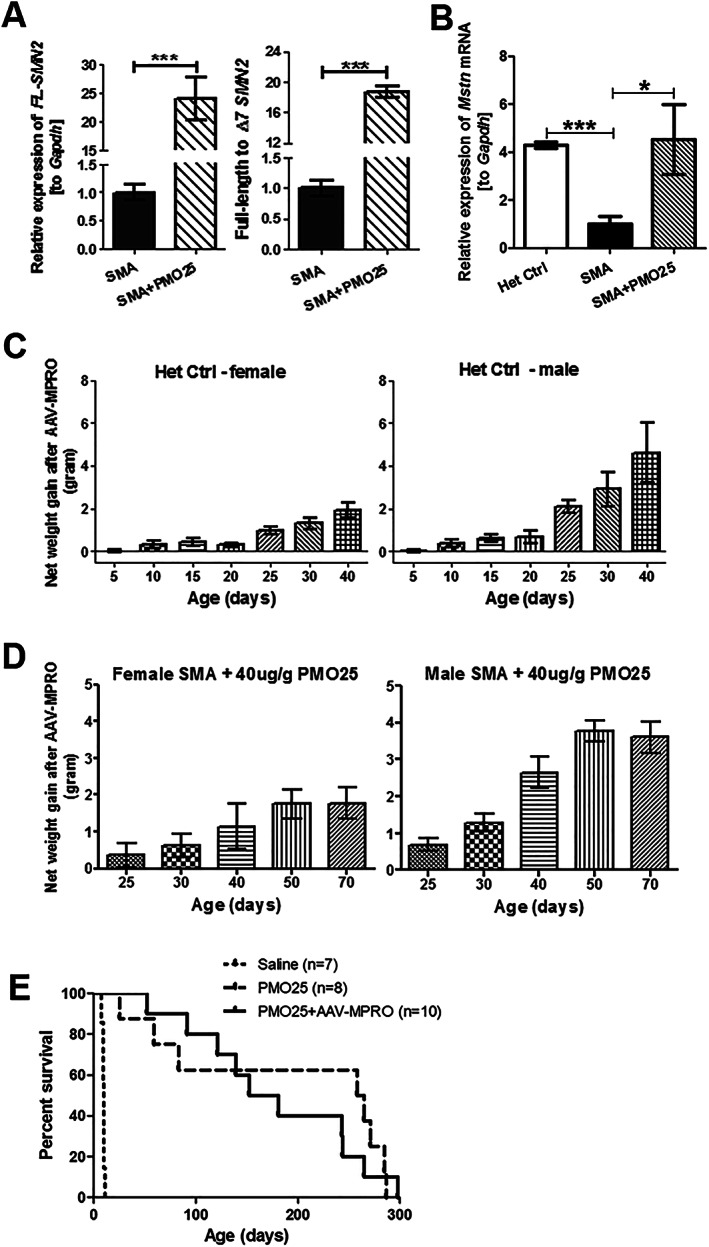
The expression of Mstn mRNA in skeletal muscle from SMA mice and the effects of myostatin inhibition on body weight and survival of severe SMA mice receiving 40 μg/g PMO25 treatment. (A) The relative expression of full‐length SMN2 (FL‐SMN2) transcripts and the ratio of full‐length to Δ7 SMN2 transcripts in TA muscles from 10‐day‐old untreated SMA mice and SMA mice treated with 40 μg/g PMO25 were measured by real‐time PCR. (n = 5 per group, *** P < 0.001, Student's t‐test). (B) The relative Mstn mRNA expression in TA muscles from 10‐day‐old mice was quantified by real‐time PCR. Significant difference was detected between SMA mice and their unaffected littermate controls (Het Ctrl) (n = 5 per group, * P < 0.05, ** P < 0.01, one‐way analysis of variance and post t‐test). Data are represented as mean ± standard error of the mean. (C) The net weight gain (g) in the unaffected heterozygous control (het control) mice. The net weight gain was calculated by deducting the average body weight of the mice without AAV‐MPRO treatment from mice receiving AAV‐MPRO treatment, from the same litter (n = 3 litters per group). (D) The net weight gain in SMA mice treated with 40 μg/g PMO25 and AAV‐MPRO, in female and male SMA mice (n = 3 litters per group). (E) Kaplan–Meier survival curves of severe SMA mice received saline (n = 7), 40 μg/g PMO25 (n = 8), and 40 μg/g PMO25 + AAV‐MPRO (n = 10). The average survivals were 10, 261, and 166 days, respectively. Log‐rank P < 0.0001 between saline control and treated groups; P = 0.6292 between PMO25 + AAV‐MPRO and PMO25.