
Figure 3.
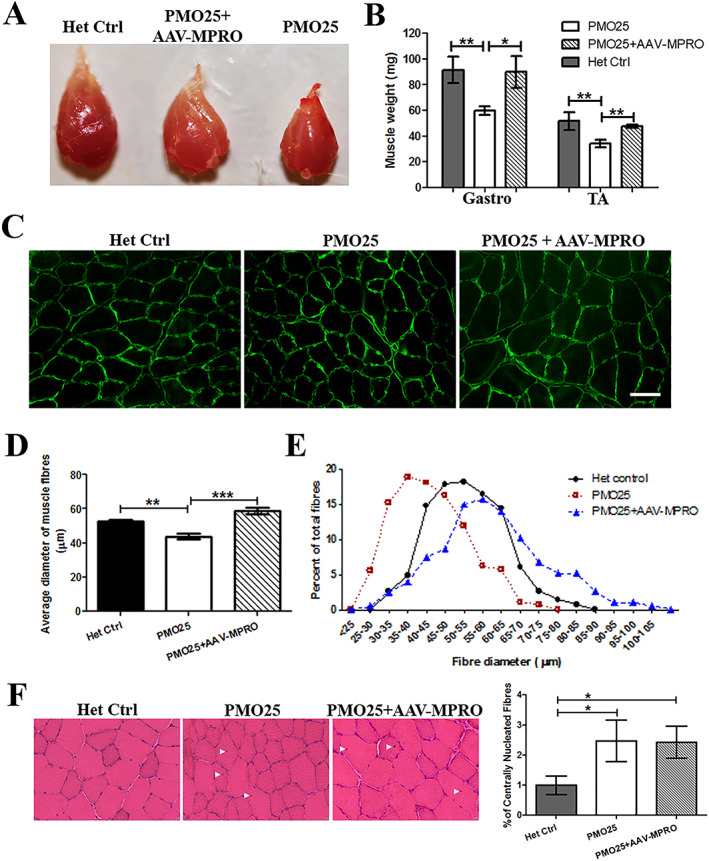
Myostatin inhibition increased muscle mass and fibre size in 40 μg/g PMO25‐treated SMA mice. (A) Representative images of TA muscles dissected from 3‐month‐old female SMA mice receiving different treatments. (B) The addition of AAV‐MPRO increased the weight of TA (Het Ctrl: 51.67 ± 6.89 mg; PMO25 only: 34 ± 3.05 mg; PMO25 + AAV‐MPRO: 47.33 ± 1.2 mg; n = 3 mice per group) and gastrocnemius muscle (Het Ctrl: 91.33 ± 10.17 mg; PMO25 only: 59.75 ± 3.42 mg; PMO25 + AAV‐MPRO: 89.75 ± 12.43 mg; n = 4 mice per group) in SMA mice receiving 40 μg/g PMO25 treatment. Student's t‐test. (C) Representative images of TA muscle fibres stained by laminin (green) for fibre size measurement from mice of different groups. Scale bar = 100 μm. (D) Mean diameters of myofibres from 3‐month‐old SMA mice receiving different treatments (PMO25 + AAV‐MPRO: 58.83 ± 2.074 μm; PMO25 only: 43.83 ± 1.467 μm; het control: 52.41 ± 1.068 μm; n = 4 mice per group). Over 200 muscle fibres were assessed in each of three mice. One‐way analysis of variance and post t‐test. (E) The percentage of different myofibre diameters from SMA mice receiving different treatments. There was a clear shift from small to large diameter fibres in per cent of total fibres in SMA mice receiving the combined PMO25 + AAV‐MPRO treatment, compared with mice receiving 40 μg/g PMO25 alone. (F) Representative images of haematoxylin and eosin staining of TA muscles and the quantification of centrally nucleated fibres in mice from different groups. The centrally located nuclei were indicated by arrowheads. * P < 0.05, ** P < 0.01, *** P < 0.001.