
Figure 2.
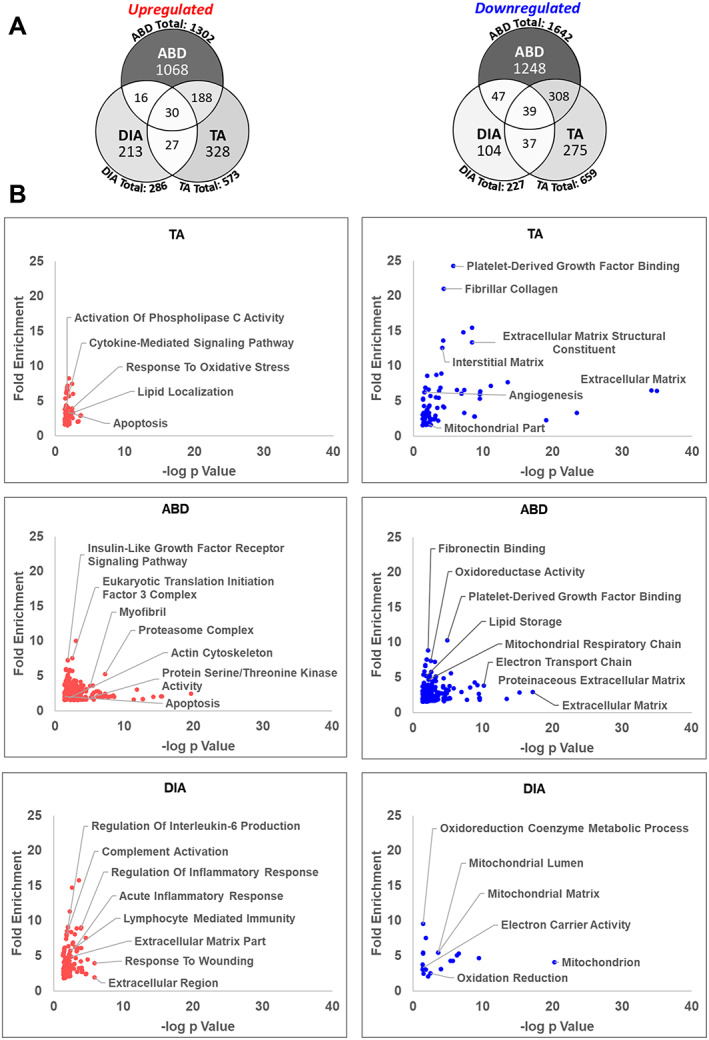
Transcriptomic analysis of the tibilais anterior (TA), abdominal (ABD), and diaphragm (DIA) of pancreatic ductal adenocarcinoma‐patient‐derived xenograft (PDX) mice. Microarray analysis was performed on TA, ABD, and DIA of PDX mice (and compared with TA, ABD, and DIA, respectively, of sham‐surgery controls). Genes up‐regulated or down‐regulated in the TA, ABD, and DIA of pancreatic ductal adenocarcinoma‐PDX mice were defined by an absolute fold change ≥ 1.5 and FDRq ≤ 0.1. (A) Venn diagrams show the number of differentially expressed genes for each muscle and the number of genes that overlap between them. Colour intensity in each segment corresponds to the percentage of genes in that segment compared with the total number of genes on the Venn diagram. (B) DAVID Gene Ontology analysis was performed to identify enriched biological process, molecular function, and cell component (CC) categories for each set of genes up‐regulated or down‐regulated in each muscle. Categories are graphed such that those with highest fold enrichment and lowest P value with be found in the upper right quadrant (n = 3 per muscle).