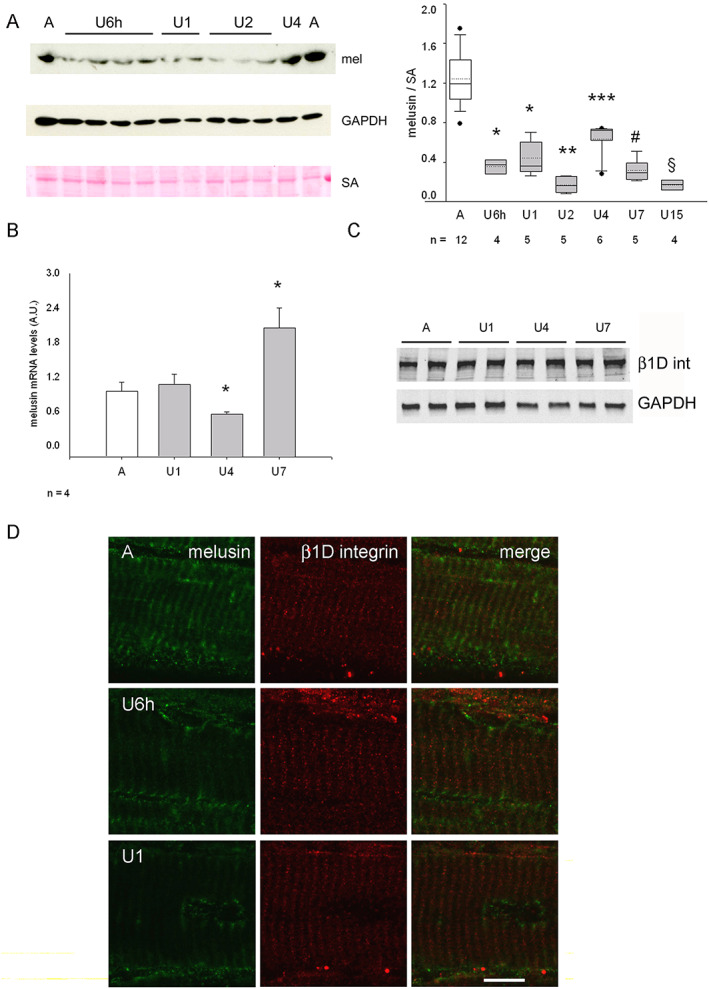
Figure 1.

(A) Left panels: representative western blot of whole homogenates from the midbelly region of ambulatory soleus muscle (A) and unloaded (U) ones for 1–4 days, stained with anti‐melusin (mel) antibodies. Red Ponceau staining of serum albumin (SA) and western blot for GAPDH are shown as loading reference. Right panel illustrates box plots with mean (dotted) and median (solid) values of normalized melusin protein levels; n indicates the number of animals examined. Single asterisk indicates significant difference to A, U4, U2, and U15 values; double asterisk indicates difference vs. all values except U15; triple asterisk indicates significant difference vs. all; # indicates significant difference to A, U4, and U2; § indicates significant difference vs. all values, except U2 (P < 0.001, ANOVA). (B) Histograms show mean and SEM values of normalized melusin mRNA levels from A and U muscles examined at each time point (ANOVA, P = 0.001). Asterisks indicate significant difference vs. all. (C) Representative western blot analysis with rabbit polyclonal anti‐β1D integrin antibodies (β1D int, upper panel) and GAPDH (lower panel) on total lysates from A and U muscles. (D) Representative confocal micrographs of double immunofluorescence with anti‐melusin mAb (left column), anti‐β1D integrin pAb (middle column), and merged images (right column) on longitudinal cryosections of ambulatory (A) soleus muscle and after 6 h (U6h) and 1 day unloading (U1). Bar: 10 μm.
