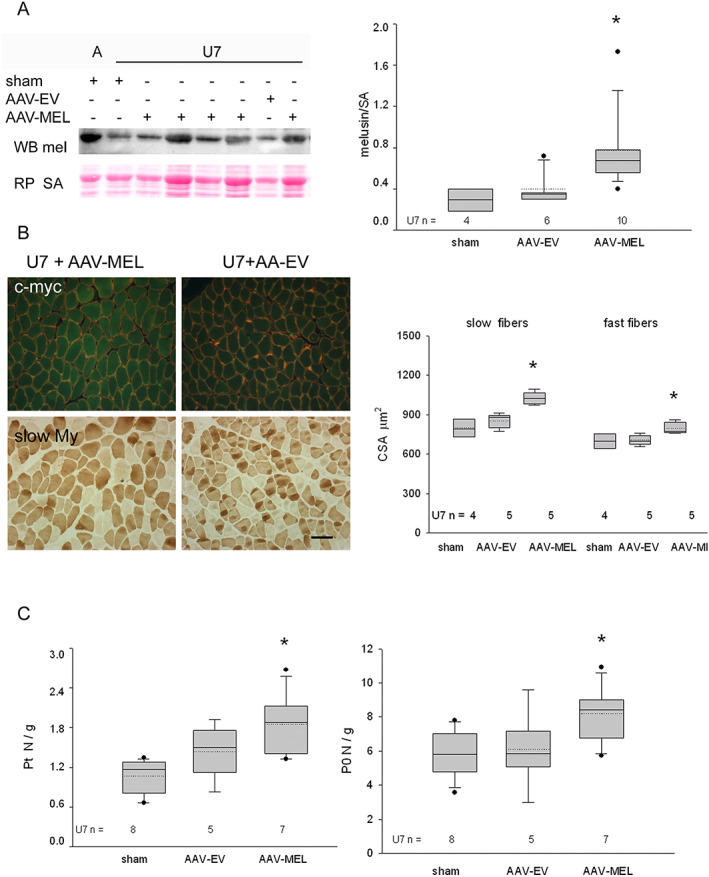
Figure 4.

(A) Left panels: western blot stained for total melusin (mel) representatively illustrates the reactivity of ambulatory soleus muscles (A) and 7 days of unloading (U7) ones after sham infection, or infection with AAV expressing melusin (AAV‐MEL) or empty vector (AAV‐EV). Red Ponceau staining of serum albumin (SA) is shown as loading reference. Right panel illustrates box plots with mean (dotted) and median (solid) values of normalized total melusin protein levels in U7 muscles; n indicates the number of examined muscles. Single asterisk indicates significant difference vs. sham‐infected and AAV‐EV‐infected muscles (P = 0.01, ANOVA). (B) Left panels: representative micrographs of consecutive cryosections U7 muscles infected with AAV‐MEL or AAV‐EV. Upper panels show double labelling with anti‐c‐myc antibody (green fluorescence) and anti‐dystrophin antibodies (red fluorescence); lower panels show immunoperoxidase staining with anti‐slow myosin (My) antibody (dark fibers). Bar: 100 μm. Right panel shows box plots of cross‐sectional area (CSA) of slow and fast myofibers in sham‐infected, AAV‐MEL‐infected, and AAV‐EV‐infected muscles after 7 days of unloading. Solid and dotted lines in boxes indicate median and mean values, respectively; n indicates the number of muscles examined; at least 100 fibers were measured for group in each muscle. Single asterisk indicates the presence of significant difference vs. sham and AAV‐EV values of the same fiber population (ANOVA, P = 0.001 and 0.01 for slow and fast fibers, respectively). (C) Box plots show mean (dotted) and median (solid) values of normalized twitch and tetanic tension, left and right panels, respectively, in U7 muscles after sham infection, infection with AAV‐EV or with AAV‐MEL; n indicates the number of examined muscles. Single asterisk indicates the presence of significant difference vs. sham‐infected muscles (P = 0.03 and 0.05, respectively, ANOVA).
