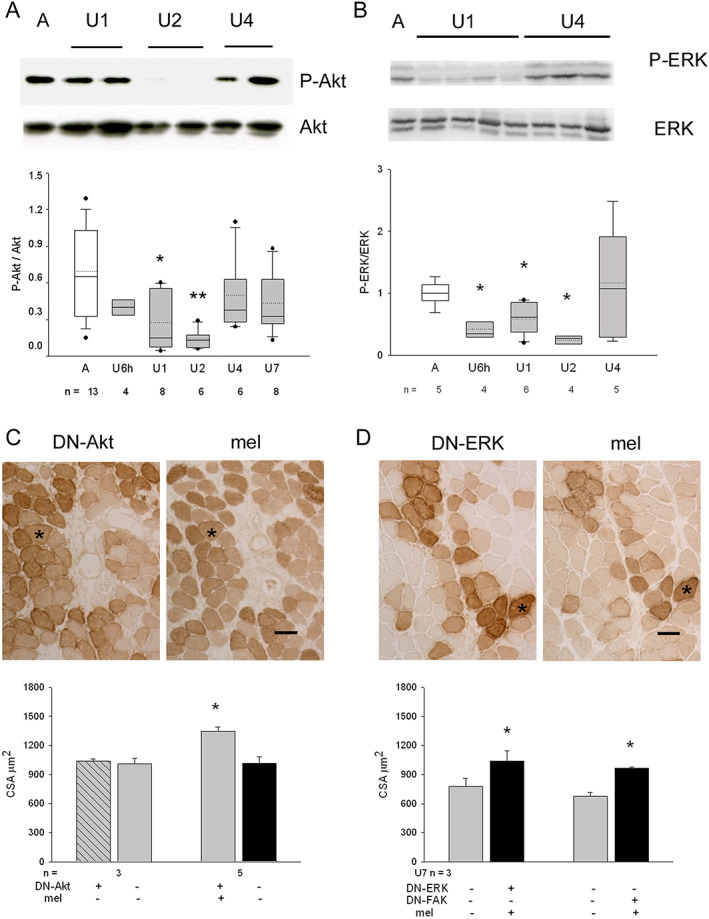
Figure 5.

(A) Upper panels show a representative western blot of whole homogenates from ambulatory soleus muscle (A) and unloaded (U) ones for 1–4 days, stained with anti‐P‐Akt and total Akt antibodies. Lower panel illustrates box plots with mean (dotted) and median (solid) values of P‐Akt/Akt ratio; n indicates the number of animals examined (P < 0.01, ANOVA). Single asterisk indicates significant difference vs. A values; double asterisk indicates difference vs. A, U6h, U4, and U7 values. (B) Upper panels show representative western blots of two parallel gels loaded with whole homogenates from the same A and U muscles and stained with anti‐P‐ERK and total ERK antibodies, respectively. Lower panel illustrates box plots with mean (dotted) and median (solid) values of P‐ERK/ERK ratio; n indicates the number of animals examined (P = 0.04, ANOVA). Single asterisk indicates significant difference vs. A values. (C) Upper panels show indirect immunoperoxidase of consecutive cryosections from a 7 day unloaded soleus co‐transfected with DN‐AKT and melusin cDNA and stained with anti‐tag antibodies (HA for DN‐AKT or c‐myc for melusin). Asterisk indicates a representative doubly transfected myofiber. Bar: 50 μm. Lower panel: histograms show mean and SEM values of myofiber cross‐sectional area (CSA) measured in positive and negative myofiber populations of U7 muscles transfected with both constructs or with DN‐Akt only; n indicates the number of muscles examined. About 100 myofibers for group were considered for muscle. Asterisk indicates significant difference vs. all (P < 0.001, within‐subject ANOVA). (D) Upper panels show indirect immunoperoxidase of consecutive cryosections from a 7 day unloaded soleus co‐transfected with DN‐ERK and melusin cDNA, stained with anti‐tag antibodies (HA for DN‐ERKD or c‐myc for melusin). Asterisk indicates a representative doubly transfected myofiber. Bar: 50 μm. Lower panel: histograms show mean and SEM values of myofiber CSA measured in positive and negative slow myofiber populations of U7 muscles doubly transfected with melusin cDNA and either DN‐ERK or DN‐FAK; n indicates the number of muscles examined. About 100 myofibers for group were considered for each muscle. Asterisks indicate significant difference vs. untransfected myofibers (P < 0.01 paired Student's t‐test).
