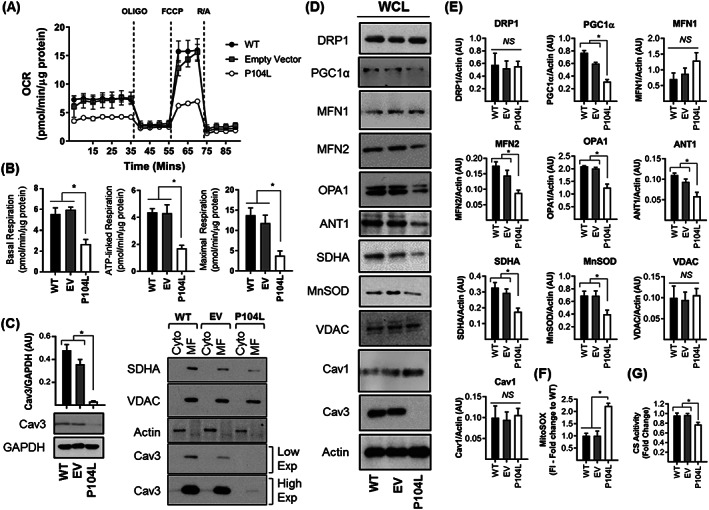
Figure 3.

Effects of expressing the Cav3P104L mutation on mitochondrial respiration and protein expression in L6 muscle cells. Wild‐type L6 muscle cells or those stably expressing an empty vector (EV) or one encoding Cav3P104L were used for analysis of cell respiration using Seahorse technology. The oxygen consumption rate (OCR) trace shown in (A) is representative from a single experiment in which each point represents mean ± SEM of a triplicate measurement. Oligomycin (1 μM), FCCP (1 μM), and a mixture of Rotenone (1 μM)/Antimycin (2 μM) were added for determination of basal, ATP‐linked, and maximal respiration (B). The abundance of Cav3 and GAPDH (used as loading control) in WT, EV, and Cav3P104L expressing L6 muscle cells was determined by immunoblotting. The bar graph quantifies Cav3 abundance relative to GAPDH (mean ± SEM) (C). Cytosolic (Cyto, 5 μg protein) and mitochondrial‐enriched fractions (MF, 5 μg protein) from WT, EV, and Cav3P104L expressing myoblasts were immunoblotted with antibodies directed to the proteins indicated. The Cav3 blots show two separate image exposures. Whole cell lysates (WCL, 30 μg protein) from WT, EV, and Cav3P104L expressing myoblasts were subject to sodium dodecyl sulfate polyacrylamide gel electrophoresis and immunoblotting with antibodies to proteins indicated (D) and their abundance quantified from a minimum of three separate experiments relative to actin (gel loading control) using Image J software (E). Analysis of superoxide content (F) was determined using fluorescence intensity (FI) of MitoSOX and citrate synthase (CS) activity in myoblasts was used as a proxy for mitochondrial mass (G). All graphical data represent mean ± SEM from a minimum of three separate experiments. Asterisks indicate a significant change (P < 0.05), whereas the NS notation signifies no significant change. Cav3, caveolin‐3; SDHA, succinate dehydrogenase subunit A; MnSOD, manganase superoxide dismutase; WT, wild type; VDAC, voltage‐dependent anion channel.
