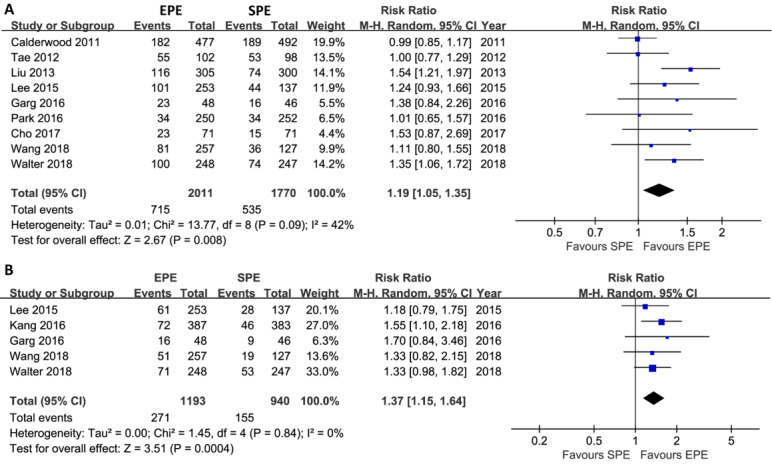
Figure 2.

Meta-analysis of the effect of EPE on PDR (A) and ADR (B). This pooled result indicated a statistical difference regarding PDR and ADR between EPE and SPE groups. The summary effect estimates (risk ratio, RR) for individual randomized controlled trial (RCT) are indicated by blue rectangles (the size of the rectangle is proportional to the study weight), with the black horizontal lines representing 95% CIs. The overall summary effect estimate (RR) and 95% CI are indicated by the black diamond below. EPE: enhanced patient education; SPE: standard patient education; PDR: polyp detection rate; ADR: adenomas detection rate; RR: risk ratio; and M-H: Mantel-Haenszel.
