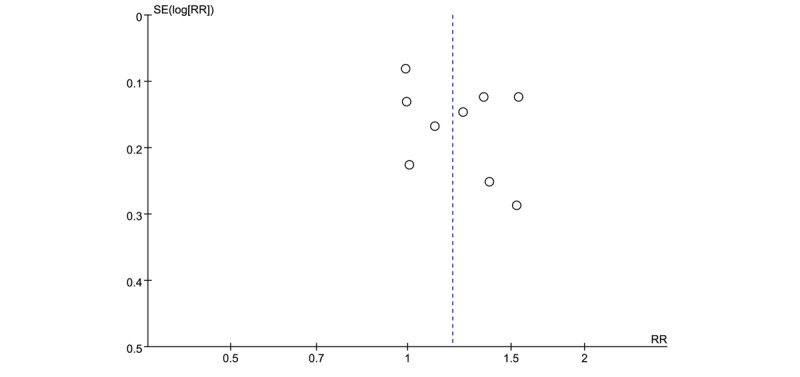
Figure 6.

Funnel plot of PDR between the EPE and SPE groups. The vertical axis represents the standard error (SE) of effect size and x-axis indicates pooled risk ratio (RR). Symmetrical funnel plot indicates the absence of publication bias. PDR: polyp detection rate; EPE: enhanced patient education; SPE: standard patient education.
