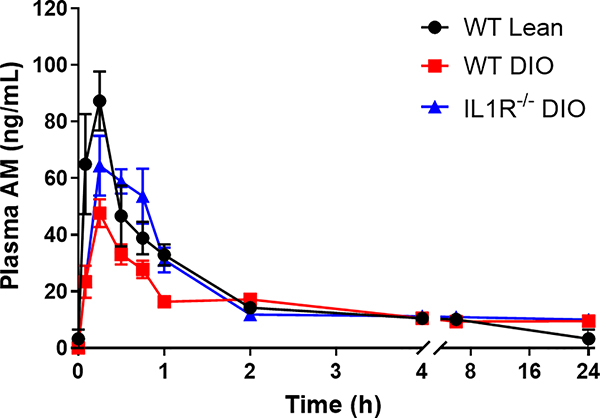
Figure 1. Mean plasma concentration-time curve of AM in WT lean, WT DIO and IL-1R−/− DIO mice after a single oral dose of 5mg/kg clopidogrel.
Plasma AM (n=3–5 each) was quantified as described in Materials and Methods. The PK parameters were obtained by fitting the data to a non-compartmental model using PKSolver. WT DIO mice showed lower peak AM concentrations (WT DIO= 47.64 ± 4.902 vs. WT lean= 95.32 ± 18.40 ng/ml, p <0.05) and lower AUC (WT DIO= 40.04 ± 2.549 vs. WT lean= 69.93 ± 8.513 ng*h/ml, p <0.05) 2 hours after dosing compared to WT lean mice. IL-1R−/− DIO mice showed higher AUC compared to WT DIO mice 2 hours after dosing (IL-1R−/− DIO= 69.79 ± 6.274 vs. WT DIO= 40.04 ± 2.549 ng*h/ml, p <0.05). AM= active metabolite, AUC= area under curve.

