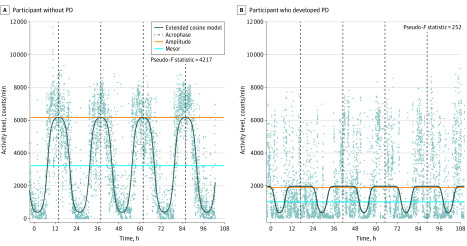
Figure 1. Activity Level by Time, With Fitted Curve for the Rest-Activity Rhythm.
Two participants were randomly selected from the study sample, one with Parkinson disease (PD) and the other without. A, This participant was in the highest quartile for amplitude and mesor as shown by the higher overall level of activity and the higher height of the fitted curve. This participant had clear sleep-wake periods as shown by the high value for rhythm robustness. The acrophase is close to the midpoint for this analysis subset. B, This participant was in the lowest quartile for amplitude and mesor as shown by the lower overall level of activity and the dampened fitted curve. This participant lacked clear sleep-wake periods as shown by the low value for rhythm robustness. The acrophase is classified as delayed. The dots indicate activity values plotted by time.

