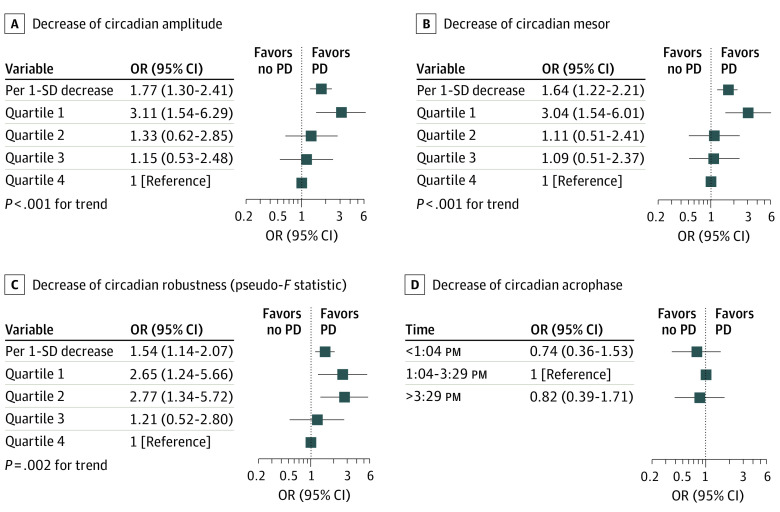
Figure 2. Multivariable-Adjusted Odds Ratios for Parkinson Disease by Quartile and per 1 SD.
Data are expressed as odds ratios (ORs) and 95% CIs. Analyses are adjusted for age, clinic site, race, educational level, number of depressive symptoms, body mass index, physical activity, benzodiazepine use, alcohol and caffeine intake, smoking, cognitive function, and history of hypertension, stroke, coronary heart disease, or type 2 diabetes.

