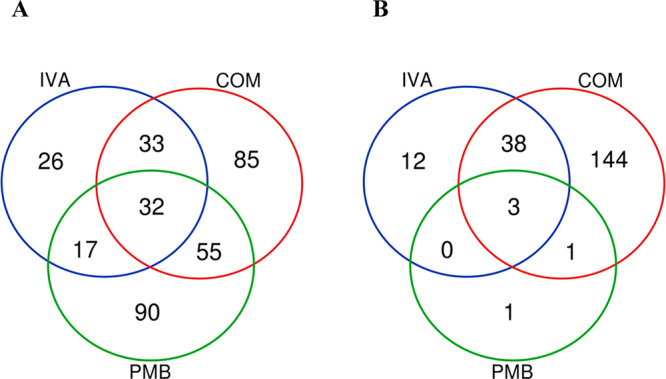
Figure 1.

Venn diagrams represent the number of metabolites significantly affected by each treatment for (A) polymyxin-susceptible (FADDI-PA111) and (B) polymyxin-resistant (FADDI-PA006) P. aeruginosa. Significant metabolites were selected (≥0.59-log2-fold, p ≤ 0.05; FDR ≤ 0.05).
