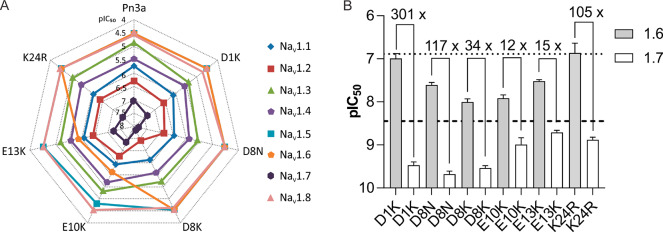
Figure 3.
NaV1.1–1.8 selectivity of Pn3a analogues with improved potency at NaV1.7. (A) Potency at hNaV1.1–1.8 represented on a radar plot assessed using fluorescence-based assays with membrane potential dye. Data is presented as the pIC50 averaged from 3 independent replicates (each with 3 identical wells per treatment). (B) Comparative potency of select Pn3a analogues at hNaV1.6 and hNaV1.7 assessed by whole-cell patch–clamp experiments. Numbers above bars indicate fold selectivity for NaV1.7 over NaV1.6. Dashed and dotted lines indicate potencies of wild-type Pn3a at NaV1.7 and NaV1.6, respectively (values for NaV1.6 are those previously reported).21 Data are presented as mean ± SEM; n = 4–7 cells.

