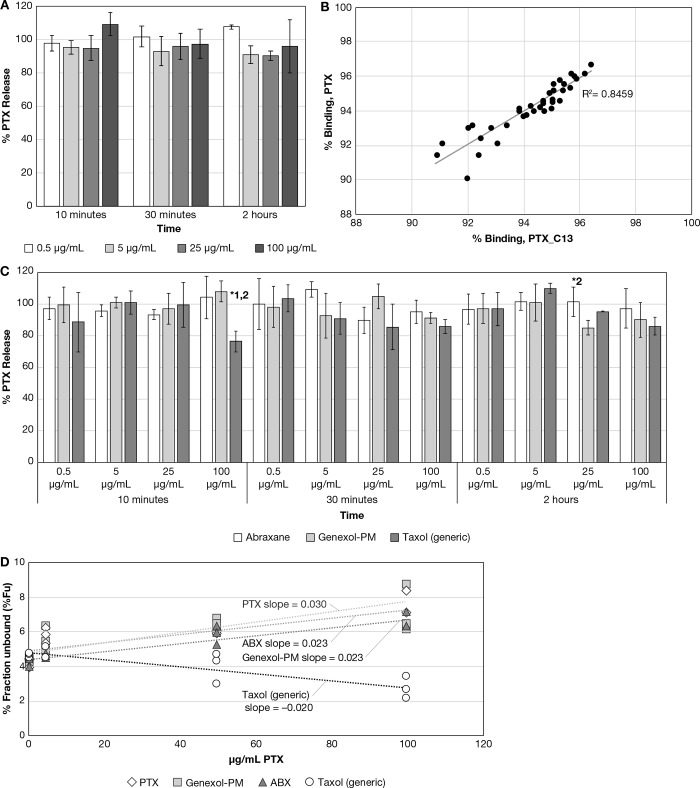
Figure 3.
(A) Solvent PTX control data for PTX formulations. Displayed is the calculated percent release for the solvent PTX control data. (mean ± SD, N = 3). (B) PTX vs PTX_C13 tracer percent binding correlation. Displayed is the percent binding correlation for PTX vs PTX_C13 tracer for the solvent PTX control study, with the dotted line showing the linear regression. (C) Abraxane, Genexol-PM, and Taxol (generic) drug release comparison. Displayed are the 10 min–2 h calculated percent release data for the Abraxane, Genexol-PM, and Taxol (generic). (mean ± SD, N = 3); *p ≤ 0.05, ANOVA, with Tukey’s posthoc test; 1,2 designates significantly different from Abraxane and Genexol-PM, respectively. (D) Abraxane, Genexol-PM, and Taxol (generic) percent unbound drug fraction vs concentration comparison. Displayed are the calculated percent unbound fraction vs concentration for Abraxane, Genexol-PM, and Taxol (generic), and linear regression fitting to the data points.

