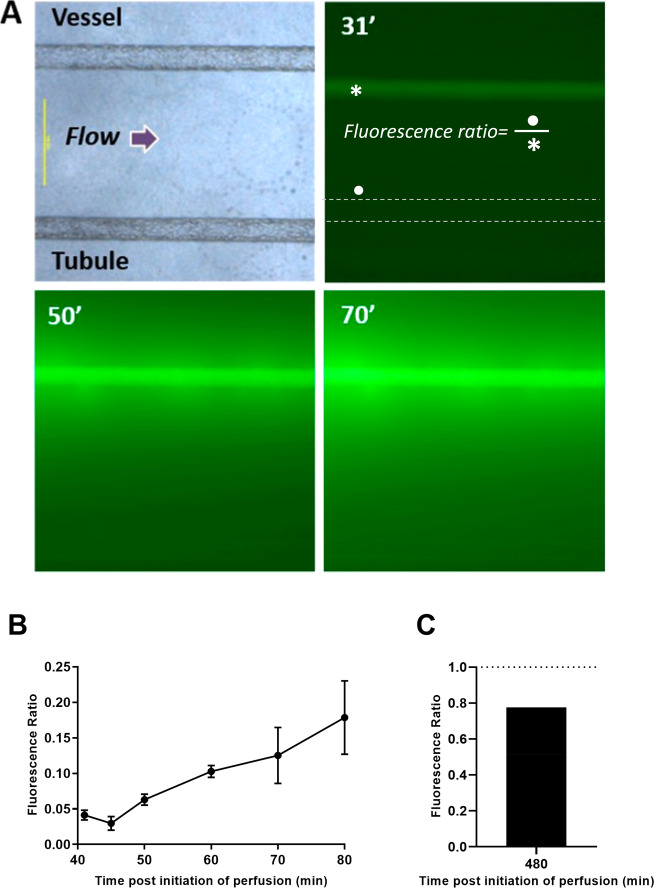
Figure 5.
Diffusion of FITC-dextran from vessel across interstitial space in the VPT-MPS. (A) Fluorescent images showing extravasation of FITC-dextran and diffusion across the interstitial matrix (diffusion distance ∼ 1000 μm) to the epithelial tubule over time. Scale bar: 500 μm (40× magnification); γ-function transformation = 0.30. (B) Time-course of fluorescence accumulation in the matrix adjacent to the basolateral aspect (•) of the epithelial tubule relative to fluorescence within the endothelial vessel (*). (C) Mean fluorescence accumulation at experimental end-point (8 h). Flow arrow indicates the direction of flow through the channels (left to right). Times given are after start of perfusion; an initial time delay occurred due to dead volume through bubble traps. Data points represent experiments from n = 3 VPT-MPS devices using cells from 3 separate donors (B) and n = 2 VPT-MPS devices using cells form 2 separate donors. Equation for fluorescence ratio can be found in the Materials and Methods.

