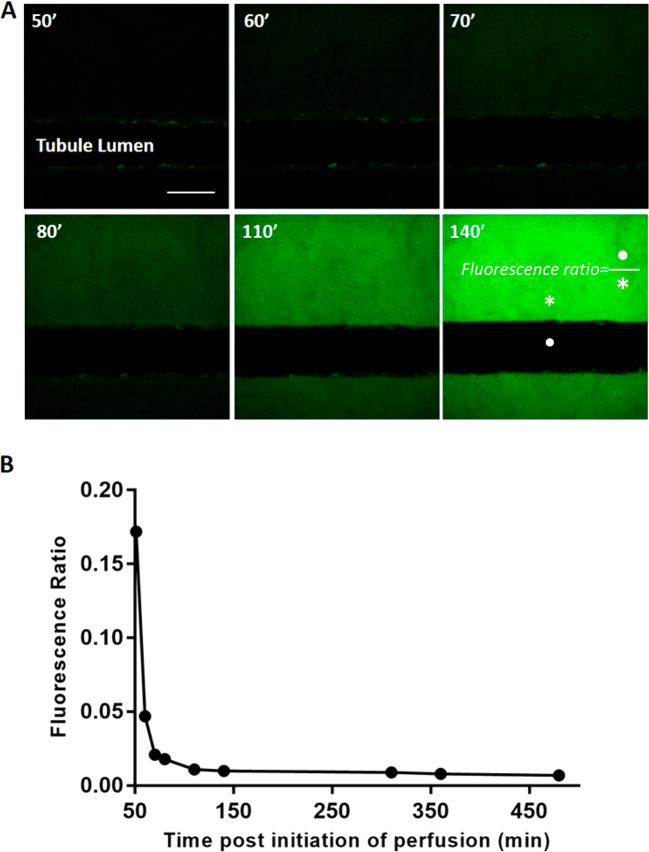
Figure 6.
Minimal translocation of FITC-dextran across the tubular epithelium into the lumen over time. (A) Representative images of FITC-dextran accumulation on the basolateral side of the tubular epithelium. Elimination of out-of-plane fluorescence highlighted the true extent of FITC-dextran translocation; 200× magnification. Scale bar: 100 μm. (B) Time-dependent decrease in fluorescence tubule/interstitium ratio; the ratio plateaued at approximately 2 h. Fluorescence intensity in the interstitium was determined immediately adjacent to the epithelial lumen facing the endothelial channel (* basolateral intensity) and in the middle of the epithelial lumen (• tubule intensity). Changes in ratio were due to increased interstitial fluorescence accumulation. Times given are after start of perfusion; an initial time delay occurred due to dead volume through bubble traps. Data points compiled from n = 2 VPT-MPS devices (each experiment with a different cell donor).

