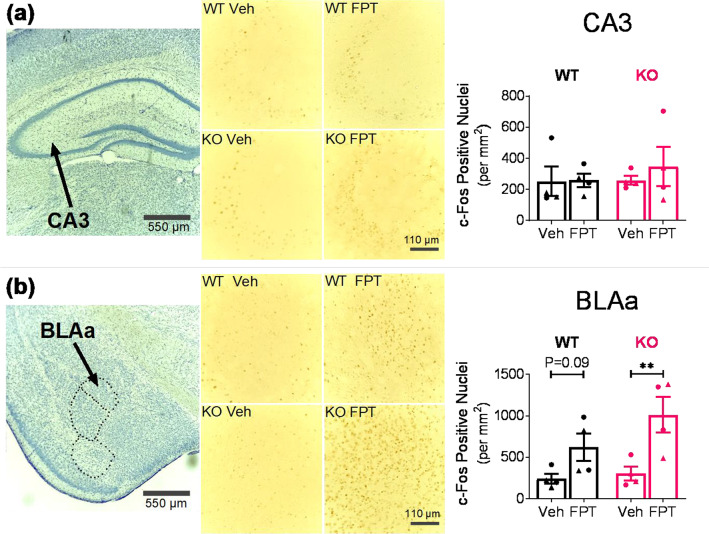
Figure 6.
Effects of FPT on c-Fos expression in the dorsal hippocampus (a) and basolateral amygdala (b) in wild-type (WT) and Fmr1 knockout (KO) mice. Top left and bottom left: Representative 4× magnification images of cresyl violet stained dorsal hippocampus and amygdala, respectively. Top middle and bottom middle: Representative 20× magnification images of DAB-stained c-Fos in CA3 and BLAa, respectively, from WT and KO mice after treatment with vehicle (Veh) or FPT. Top right: FPT did not significantly increase c-Fos expression in CA3. Bottom right: FPT significantly increased c-Fos expression in the BLAa of KO mice and tended to increase c-Fos expression in the BLAa of WT mice.

