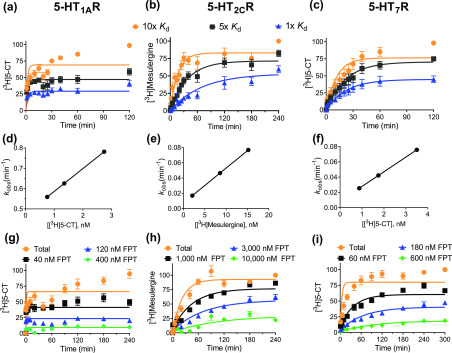
Figure 8.
Determination of radioligand and FPT kinetic binding parameters at 5-HT1ARs, 5-HT2CRs and 5-HT7Rs. (a–c) Association kinetics of three concentrations of radioligand (10×, 5×, and 1× Kd) at (a) 5-HT1ARs, (b) 5-HT2CRs, and (c) 5-HT7Rs. (d–f) Plot of the observed association rate versus radioligand concentration yields a linear relationship for 5-HT1ARs, 5-HT2CRs, and 5-HT7Rs, indicative of ligand binding to a single site. (g–i) Competition kinetics of varying concentrations of unlabeled FPT in the presence of 5–10 nM radioligand at 5-HT1ARs, 5-HT2CRs, and 5-HT7Rs. Data are organized in columns by receptor, and in rows by assay format. Association curves were derived from 3–5 independent experiments, normalized where the specific binding of radioligand at the latest time point is 100%, and binding at time 0 is fixed to 0%. Data reporting the kobs (kobs = (kon × [radioligand]) + koff) are presented in singlet form from an individual association binding experiment.

