Figure 5.
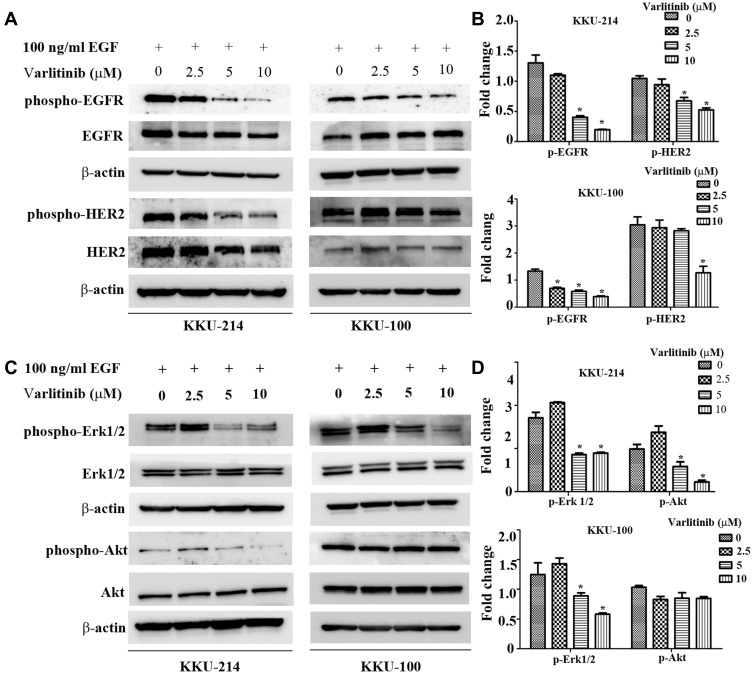
Molecular mechanisms by which varlitinib suppresses CCA cell growth. KKU-214 and KKU-100 cells were exposed to varlitinib at the indicated concentrations for 24 hrs, then induced with 100 ng/mL of EGF for 30 mins, proteins expression level were determined by Western blot analysis.
Notes: (A) The activation of EGFR and HER2. (B) The expression of p-EGFR and p-HER2 after normalized with total EGFR, HER2 and β-actin. (C) The activation the downstream signaling molecules Erk1/2 and Akt. (D) The expression of p-Erk1/2 and p-Akt after normalized with total Erk1/2, AKT and β-actin. Data in (B and D) are represented as mean±SD of three independent experiments. Asterisks indicate statistical significance (p <0.001) compared to the control, analyzed by one-way ANOVA.

