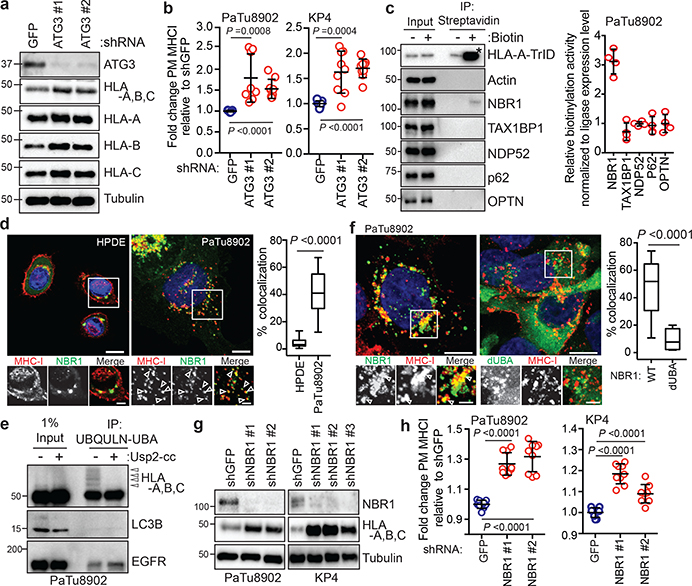
Fig. 2 |. NBR1 promotes MHC-I trafficking to the lysosome through an autophagy dependent pathway.
a, Effect of ATG3 knockdown on HLA-A,B,C levels in PaTu8902 cells. b, Flow cytometry-based quantification of plasma membrane (PM) MHC-I (HLA-A,B,C) levels (PaTu8902, n = 9, 8, 9; KP4, n = 9 per group; data pooled from 3 independent experiments) following ATG3 knockdown. c, KP4 cells expressing HLA-A-TurboID-Flag (HLA-A-TrID) were labeled with 10 μM biotin for 30 min. Biotinylation of proteins was detected following streptavidin pull down. Asterisk denotes self-biotinylation of HLA-A-TrID. Graph shows enrichment for each receptor (n = 4 independent experiments). d, Localization of MHC-I (red) relative to GFP-NBR1 (green) in HPDE and PaTu8902 cells. Arrowheads show examples of co-localization. Scale, 20 μm. Graph shows quantification of co-localization (HPDE, n = 23 fields; PaTu8902, n = 20 fields). e, Endogenous ubiquitylated proteins were affinity captured from PaTu8902 cells with UBQLN1 UBA conjugated beads. Arrowheads indicate MHC-I polyubiquitylation. Treatment of affinity captured samples for 1 hr with purified Usp2-cc (+) to induce deubiquitylation leads to loss of MHC-I polyubiquitylation. Control proteins: LC3B (no ubiquitylation) and EGFR (mono-ubiquitylation). f, Endogenous MHC-I co-localizes with WT GFP-NBR1 but not GFP-NBR1 lacking its UBA domain (dUBA). Graph shows quantification of colocalization (GFP-NBR1; n = 17 fields; GFP-NBR1 dUBA; n = 14 fields). Scale, 20 μm (inset 10 μm). g, Effect of NBR1 knockdown on MHC-I levels. h, Flow cytometry-based quantification of PM MHC-I (n = 9 replicates from 3 independent experiments) following NBR1 knockdown. Scale bar, 50 μm (d,f). A representative of at least two independent experiments is shown in a,e,g. Data are mean ± s.d. (b,c,h). For box-and-whisker plots (d,f), centerlines indicate median and whiskers represent minimum and maximum values. P values determined by unpaired two-tailed t-tests. For gel source data of a,c,e,g, see Supplementary Fig. 1.

