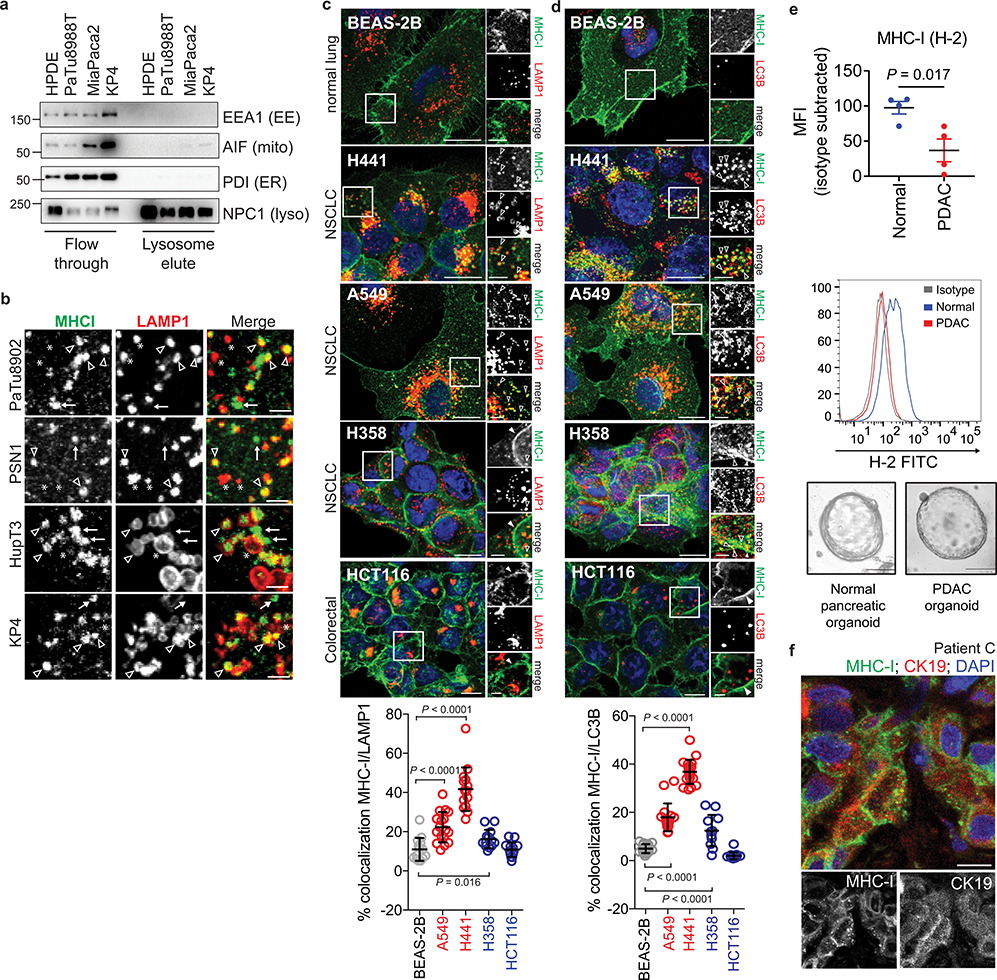
Extended Data Figure 1 |. Heterogeneous distribution of MHC-I in KRas mutant cancers.
a, Immuno-isolation of intact lysosomes from HPDE and PDAC cell lines showing absence of non-lysosome markers as indicated. EE, early endosome; mito, mitochondria; ER, endoplasmic reticulum; lyso, lysosome. b, High power images showing MHC-I positive / LAMP1 positive (arrowheads), MHC-I positive / LAMP1 negative (arrows) and MHC-I negative / LAMP1 positive (asterisk) puncta. Scale bar, 5 μm. c,d, Localization of MHC-I (green) relative to LAMP1 (red) positive lysosomes (BEAS-2B, n = 14; A549, n = 17; H441, n = 15; H358, n = 13; HCT116, n = 13) (c) or LC3B (red) positive autophagosomes (BEAS-2B, n = 18; A549, n = 17; H441, n = 20; H358, n = 12; HCT116, n = 15) (d) in the indicated cell lines. Graphs show quantification of percentage co-localization. Cell lines indicated in red show significantly increased co-localization relative to BEAS-2B cells while cell lines indicated in blue show a modest increase (H358) or no difference (HCT116). Data are mean ± s.d. (c,d). Scale bar, 20 μm and 10 μm (insert). e, Flow cytometry-based analysis of surface MHC-I (H-2) in murine normal pancreas (C57Bl/6) and murine PDAC cells grown as organoids. (Top) Isotype-subtracted geometric mean fluorescence intensity (MFI). Each dot represents different animals/lines (n = 4). Data are mean ± s.e.m. (Middle) Representative flow cytometry plots. (Bottom) Representative images of organoids. f, Immunofluorescent staining images from a patient in Fig. 1g showing intracellular localization of MHC-I (green) in CK19 positive (red) ducts. Scale, 20 μm. A representative of at least two independent experiments is shown in a,b,e. P values determined by unpaired two-tailed t-tests (c-e). For gel source data of a, see Supplementary Fig. 1.

