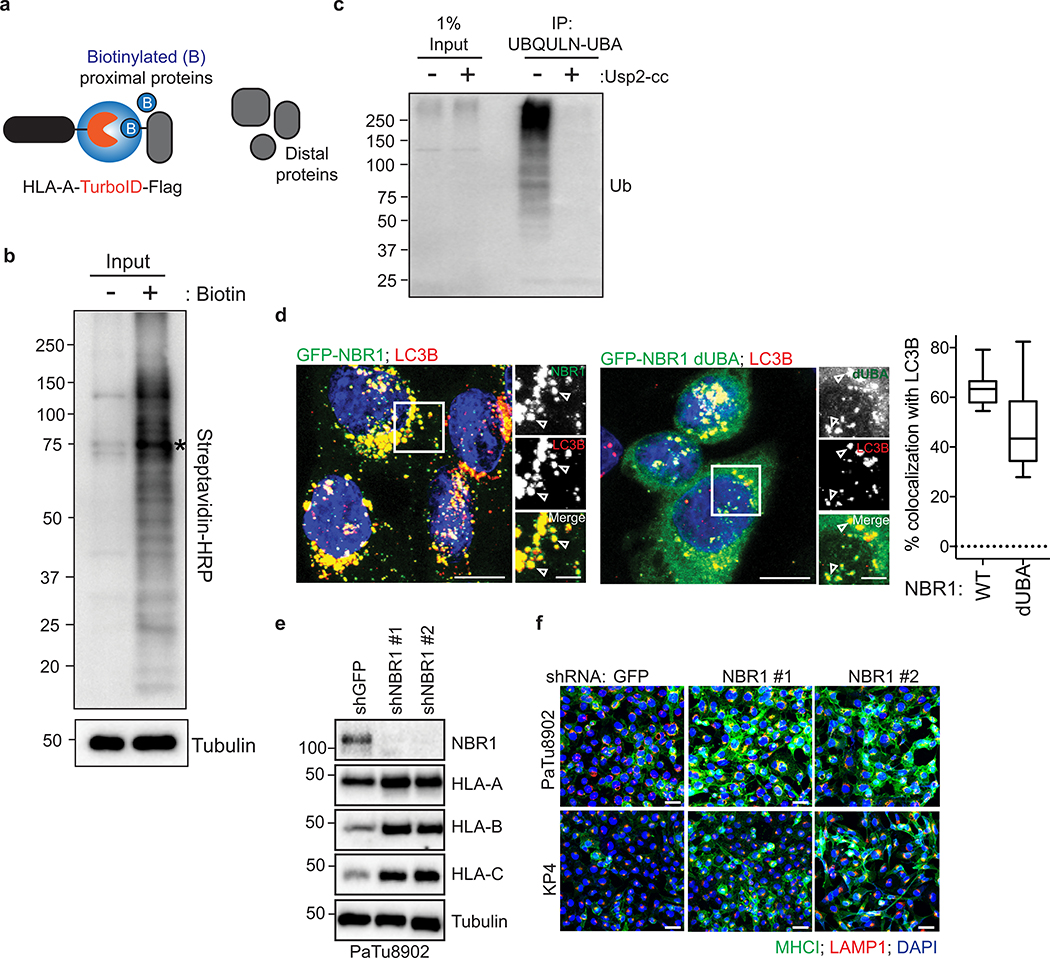
Extended Data Figure 4 |. The UBA domain of NBR1 is required for interaction with MHC-I.
a, (Related to Fig. 2c) Proximity-dependent biotinylation catalyzed by the TurboID biotin ligase conjugated to the C-terminus of HLA-A and Flag (HLA-A-TrID). Following addition of biotin, TurboID catalyzes the formation of biotin-5’-AMP anhydride which enables covalent tagging of endogenous proteins with biotin within a few nanometers of the ligase. b, (Related to Fig. 2c) HLA-A-TurboID was stably expressed in KP4 cells. Cells were treated with 10 μM of exogenous biotin for 30 min. After labeling, cells were lysed and biotinylated proteins were enriched with streptavidin conjugated beads. Biotinylated proteins were detected using streptavidin-HRP (b) or with antibodies against the indicated proteins (refer to Fig. 2c). Asterisks indicates ligase self-biotinylation. c, (Related to Fig. 2e) Endogenous ubiquitylated proteins were affinity captured from PaTu8902 cells with UBQLN1 UBA conjugated beads. Treatment of affinity captured samples for 1 hr with purified Usp2-cc (+) to induce deubiquitylation leads to loss of ubiquitylation. d, (Related to Fig. 2f) PaTu8902 cells stably expressing WT NBR1 (GFP-NBR1, n = 19 fields) or lacking the UBA domain (GFP-NBR1 dUBA, n = 16 fields) were co-stained for endogenous LC3B. Graph shows quantification of percent colocalization. Centerline indicates the median and whiskers represent the minimum and maximum values. Scale, 20 μm (insert 10 μm). e, (Related to Fig. 2g) Effect of NBR1 knockdown on respective HLA-A, B, and C levels in PaTu8902 cells. Note that blotting images for NBR1 and Tubulin are the same ones as in Fig. 2g. f, Immunofluorescence staining of MHC-I following NBR1 knockdown. Scale, 50 μm. A representative of at least three independent experiments is shown in b,c,e,f. For gel source data of b,c,e, see Supplementary Fig. 1.

