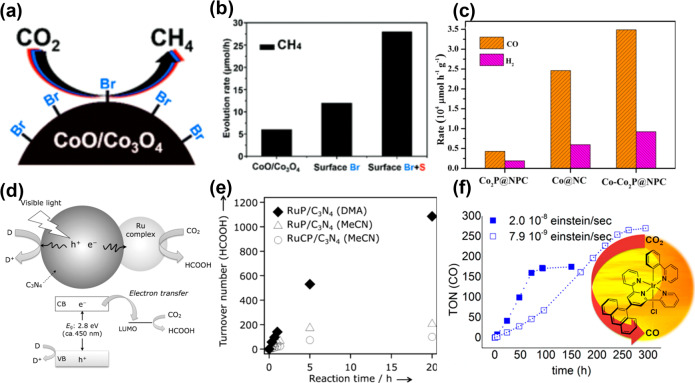
Figure 3.
(a) Schematic illustration of N-bromosuccinimide treated cobalt oxide nanoparticles and (b) CH4 formation rate over catalysts with different surface treatments. Reprinted with permission from ref (99). Copyright 2019 Royal Society of Chemistry. (c) Comparison of CO2 reduction performances of different catalysts. Reprinted with permission from ref (102). Copyright 2019 Wiley-VCH. (d) Schematic illustration of CO2 reduction using a Ru complex/C3N4 hybrid photocatalyst and (e) the turnover number of HCOOH production as a function of irradiation time using different photocatalysts and solvents. Reprinted with permission from ref (103). Copyright 2019 Wiley-VCH. (f) The turnover number of CO evolution as a function of irradiation time over modified iridium(III) photocatalyst. Reprinted from ref (104). Copyright 2017 American Chemical Society.

